

signal strength 1 of 5
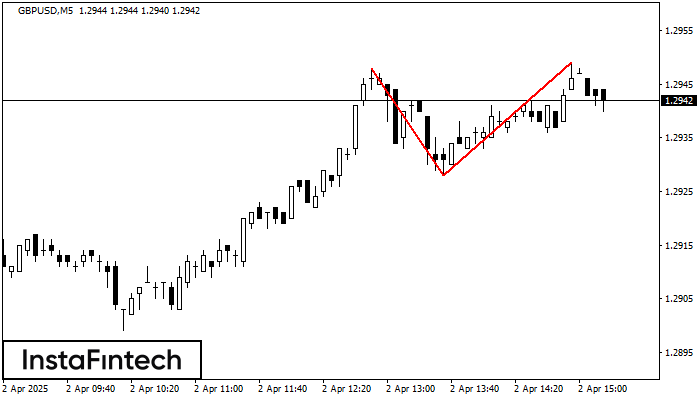
The Double Top reversal pattern has been formed on GBPUSD M5. Characteristics: the upper boundary 1.2948; the lower boundary 1.2928; the width of the pattern is 21 points. Sell trades are better to be opened below the lower boundary 1.2928 with a possible movements towards the 1.2913 level.
The M5 and M15 time frames may have more false entry points.
- All
- Double Top
- Flag
- Head and Shoulders
- Pennant
- Rectangle
- Triangle
- Triple top
- All
- #AAPL
- #AMZN
- #Bitcoin
- #EBAY
- #FB
- #GOOG
- #INTC
- #KO
- #MA
- #MCD
- #MSFT
- #NTDOY
- #PEP
- #TSLA
- #TWTR
- AUDCAD
- AUDCHF
- AUDJPY
- AUDUSD
- EURCAD
- EURCHF
- EURGBP
- EURJPY
- EURNZD
- EURRUB
- EURUSD
- GBPAUD
- GBPCHF
- GBPJPY
- GBPUSD
- GOLD
- NZDCAD
- NZDCHF
- NZDJPY
- NZDUSD
- SILVER
- USDCAD
- USDCHF
- USDJPY
- USDRUB
- All
- M5
- M15
- M30
- H1
- D1
- All
- Buy
- Sale
- All
- 1
- 2
- 3
- 4
- 5
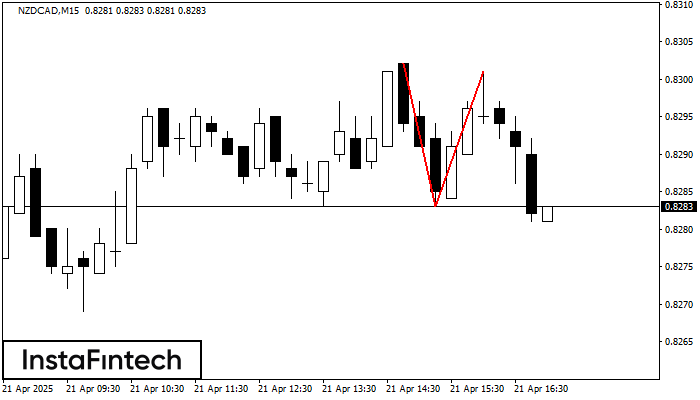
รูปแบบ รูปแบบกราฟจุดสองยอด (Double Top) ถูกสร้างขึ้นมาใน NZDCAD M15 มันแสดงให้เห็นว่า แนวโน้มได้มีการเปลี่ยนแปลงจากแนวโน้มขาขึ้น ไปเป็นขาลง บางที ถ้ามีการเคลื่อนตัวทะลุผ่าน ฐานของรูปแบบออกไป 0.8283 การเคลื่อนไหวลงด้านล่างจะยังคงเกิดขึ้น
ขอบเตระยะเวลาใน M5 และ M15 อาจจะมีตำแหน่งการเข้าใช้งานที่ผิดพลาดมากยิ่งขึ้น
Open chart in a new windowwas formed on 21.04 at 15:33:18 (UTC+0)
signal strength 2 of 5

อ้างอิงจากชาร์ตของ M15, #Bitcoin ที่ได้สร้างรูปแบบ รูปแบบสามเหลี่ยมสมมาตรขาขึ้น (Bullish Symmetrical Triangle) ออกมา คำอธิบาย: นี้คือรูปแบบของความต่อเนื่องในแนวโน้ม 87754.54 และ 86429.29 เป็นพิกัดของขอบเขตด้านบนและด้านล่าง
ขอบเตระยะเวลาใน M5 และ M15 อาจจะมีตำแหน่งการเข้าใช้งานที่ผิดพลาดมากยิ่งขึ้น
Open chart in a new windowwas formed on 21.04 at 15:29:52 (UTC+0)
signal strength 3 of 5

รูปแบบ รูปแบบกราฟจุดสองยอดขาลง (Double Bottom) ถูกสร้างขึ้นมาใน GBPCHF M30 การก่อตัวเช่นนี้แสดงถึงการย้อนตัวของแนวโน้มจากด้านล่าง ขึ้นมายังด้านบน สัญญาณแสดงให้เห็นถึง การเทรดแบบการซื้อที่ควรเปิด หลังจากที่มีการเคลื่อนตัวทะลุผ่านขอบเขตด้านบนของรูปแบบ 1.0810 การเคลื่อนไหวต่อจากนั้นจะอยู่ในความกว้างของรูปแบบปัจจุบัน
Open chart in a new window


