


signal strength 2 of 5

According to the chart of M15, #Bitcoin formed the Bullish Symmetrical Triangle pattern. Description: This is the pattern of a trend continuation. 87754.54 and 86429.29 are the coordinates of the upper and lower borders respectively. The pattern width is measured on the chart at 132525 pips. Outlook: If the upper border 87754.54 is broken, the price is likely to continue its move by 87116.24.
The M5 and M15 time frames may have more false entry points.
- All
- Double Top
- Flag
- Head and Shoulders
- Pennant
- Rectangle
- Triangle
- Triple top
- All
- #AAPL
- #AMZN
- #Bitcoin
- #EBAY
- #FB
- #GOOG
- #INTC
- #KO
- #MA
- #MCD
- #MSFT
- #NTDOY
- #PEP
- #TSLA
- #TWTR
- AUDCAD
- AUDCHF
- AUDJPY
- AUDUSD
- EURCAD
- EURCHF
- EURGBP
- EURJPY
- EURNZD
- EURRUB
- EURUSD
- GBPAUD
- GBPCHF
- GBPJPY
- GBPUSD
- GOLD
- NZDCAD
- NZDCHF
- NZDJPY
- NZDUSD
- SILVER
- USDCAD
- USDCHF
- USDJPY
- USDRUB
- All
- M5
- M15
- M30
- H1
- D1
- All
- Buy
- Sale
- All
- 1
- 2
- 3
- 4
- 5
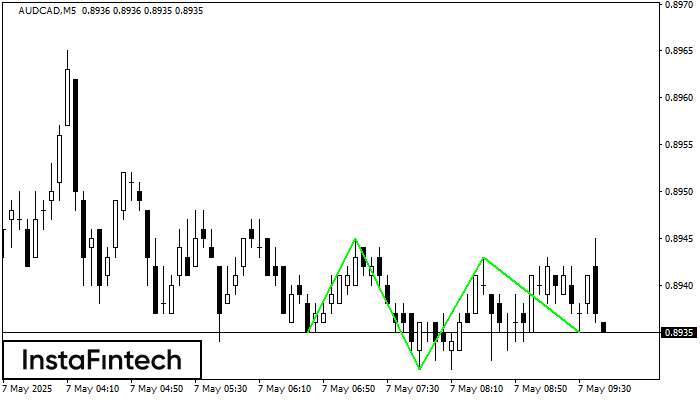
According to the chart of M5, AUDCAD produced the pattern termed the Inverse Head and Shoulder. The Head is fixed at 0.8931 while the median line of the Neck
The M5 and M15 time frames may have more false entry points.
Open chart in a new window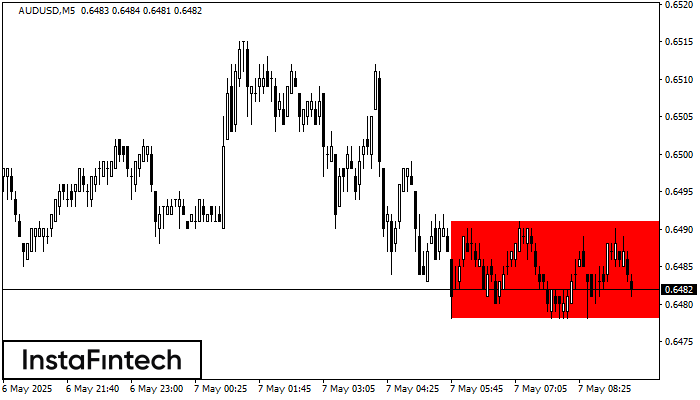
According to the chart of M5, AUDUSD formed the Bearish Rectangle. The pattern indicates a trend continuation. The upper border is 0.6491, the lower border is 0.6478. The signal means
The M5 and M15 time frames may have more false entry points.
Open chart in a new window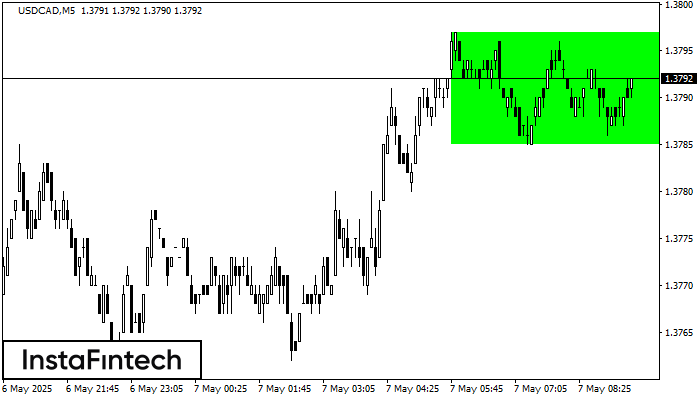
According to the chart of M5, USDCAD formed the Bullish Rectangle. The pattern indicates a trend continuation. The upper border is 1.3797, the lower border is 1.3785. The signal means
The M5 and M15 time frames may have more false entry points.
Open chart in a new window


