

signal strength 1 of 5

The Bearish Flag pattern has been formed on the chart AUDCAD M5 which signals that the downward trend will continue. If the price breaks below the low at 0.8881, then it is most likely to move further downwards. The price will likely move by the number of points which equals the length of the flag pole (10 points).
The M5 and M15 time frames may have more false entry points.
Xem thêm
- All
- Double Top
- Flag
- Head and Shoulders
- Pennant
- Rectangle
- Triangle
- Triple top
- All
- #AAPL
- #AMZN
- #Bitcoin
- #EBAY
- #FB
- #GOOG
- #INTC
- #KO
- #MA
- #MCD
- #MSFT
- #NTDOY
- #PEP
- #TSLA
- #TWTR
- AUDCAD
- AUDCHF
- AUDJPY
- AUDUSD
- EURCAD
- EURCHF
- EURGBP
- EURJPY
- EURNZD
- EURRUB
- EURUSD
- GBPAUD
- GBPCHF
- GBPJPY
- GBPUSD
- GOLD
- NZDCAD
- NZDCHF
- NZDJPY
- NZDUSD
- SILVER
- USDCAD
- USDCHF
- USDJPY
- USDRUB
- All
- M5
- M15
- M30
- H1
- D1
- All
- Buy
- Sale
- All
- 1
- 2
- 3
- 4
- 5
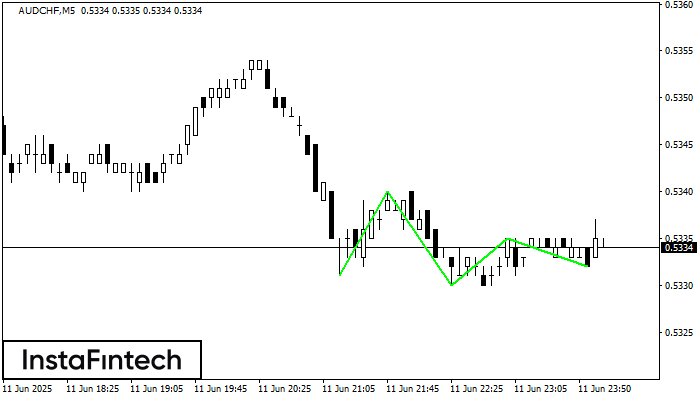
The Triple Bottom pattern has been formed on AUDCHF M5. It has the following characteristics: resistance level 0.5340/0.5335; support level 0.5331/0.5332; the width is 9 points. In the event
The M5 and M15 time frames may have more false entry points.
Open chart in a new window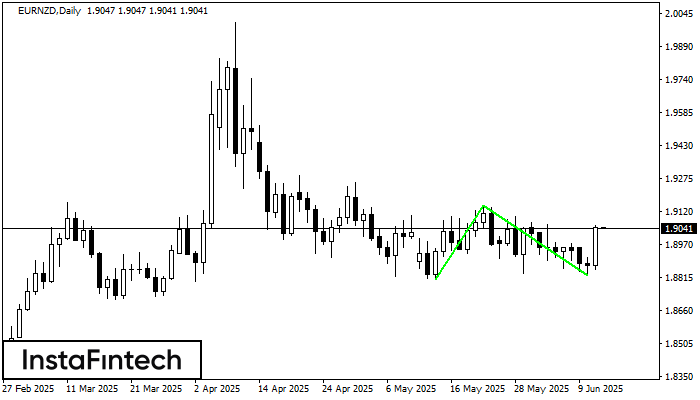
The Double Bottom pattern has been formed on EURNZD D1. Characteristics: the support level 1.8805; the resistance level 1.9150; the width of the pattern 345 points. If the resistance level
Open chart in a new window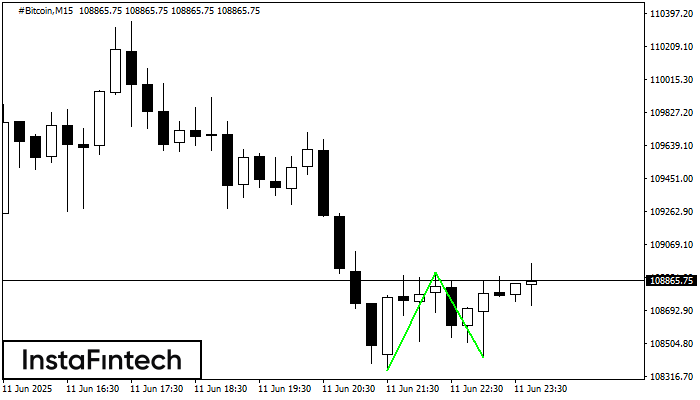
The Double Bottom pattern has been formed on #Bitcoin M15. Characteristics: the support level 108349.64; the resistance level 108909.75; the width of the pattern 56011 points. If the resistance level
The M5 and M15 time frames may have more false entry points.
Open chart in a new window


