

signal strength 1 of 5
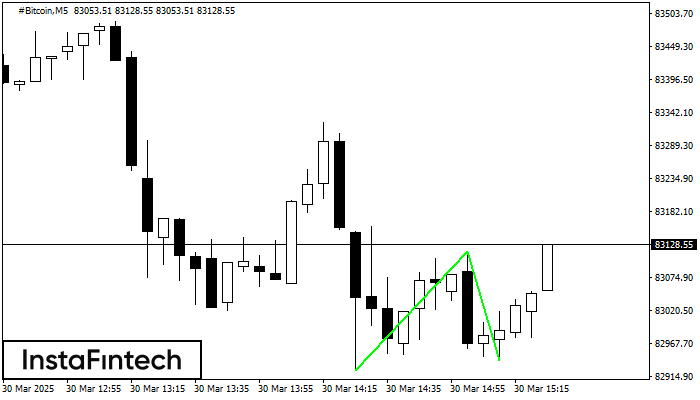
The Double Bottom pattern has been formed on #Bitcoin M5. This formation signals a reversal of the trend from downwards to upwards. The signal is that a buy trade should be opened after the upper boundary of the pattern 83117.65 is broken. The further movements will rely on the width of the current pattern 19331 points.
The M5 and M15 time frames may have more false entry points.
Xem thêm
- All
- Double Top
- Flag
- Head and Shoulders
- Pennant
- Rectangle
- Triangle
- Triple top
- All
- #AAPL
- #AMZN
- #Bitcoin
- #EBAY
- #FB
- #GOOG
- #INTC
- #KO
- #MA
- #MCD
- #MSFT
- #NTDOY
- #PEP
- #TSLA
- #TWTR
- AUDCAD
- AUDCHF
- AUDJPY
- AUDUSD
- EURCAD
- EURCHF
- EURGBP
- EURJPY
- EURNZD
- EURRUB
- EURUSD
- GBPAUD
- GBPCHF
- GBPJPY
- GBPUSD
- GOLD
- NZDCAD
- NZDCHF
- NZDJPY
- NZDUSD
- SILVER
- USDCAD
- USDCHF
- USDJPY
- USDRUB
- All
- M5
- M15
- M30
- H1
- D1
- All
- Buy
- Sale
- All
- 1
- 2
- 3
- 4
- 5
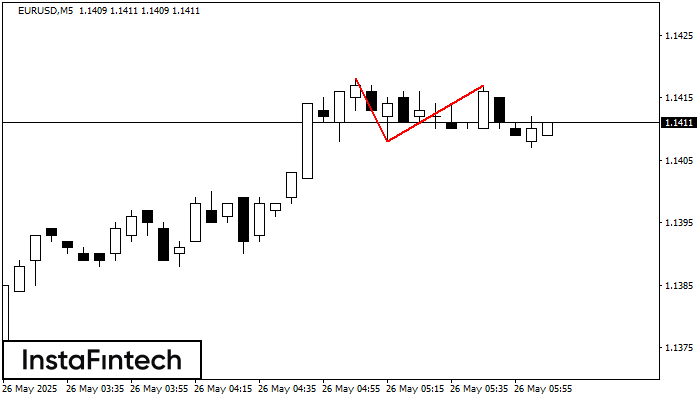
Trên biểu đồ EURUSD M5, mô hình đảo chiều Đỉnh đôi đã được hình thành. Đặc điểm: ranh giới trên ở 1.1417; ranh giới dưới ở 1.1408; chiều rộng
Khung thời gian M5 và M15 có thể có nhiều điểm vào lệnh sai hơn.
Open chart in a new window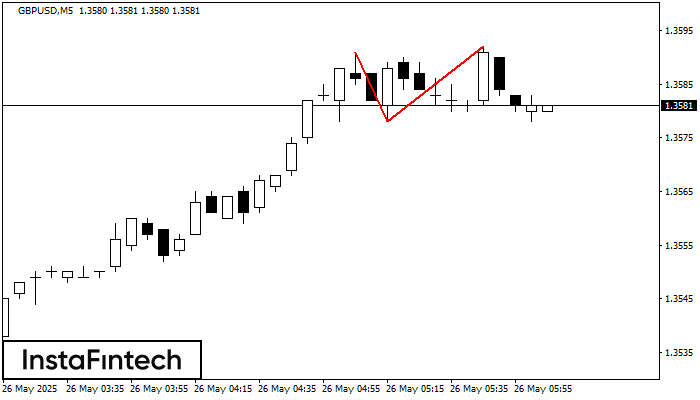
Trên biểu đồ GBPUSD M5, mô hình đảo chiều Đỉnh đôi đã được hình thành. Đặc điểm: ranh giới trên ở 1.3592; ranh giới dưới ở 1.3578; chiều rộng
Khung thời gian M5 và M15 có thể có nhiều điểm vào lệnh sai hơn.
Open chart in a new window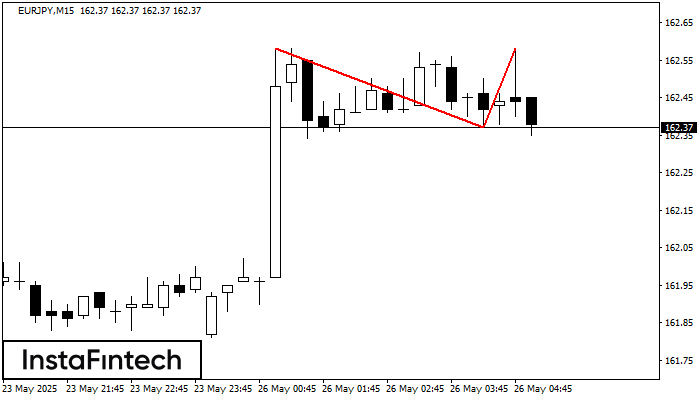
Trên biểu đồ EURJPY M15, mô hình đảo chiều Đỉnh đôi đã được hình thành. Đặc điểm: ranh giới trên ở 162.58; ranh giới dưới ở 162.37; chiều rộng
Khung thời gian M5 và M15 có thể có nhiều điểm vào lệnh sai hơn.
Open chart in a new window


