

signal strength 1 of 5
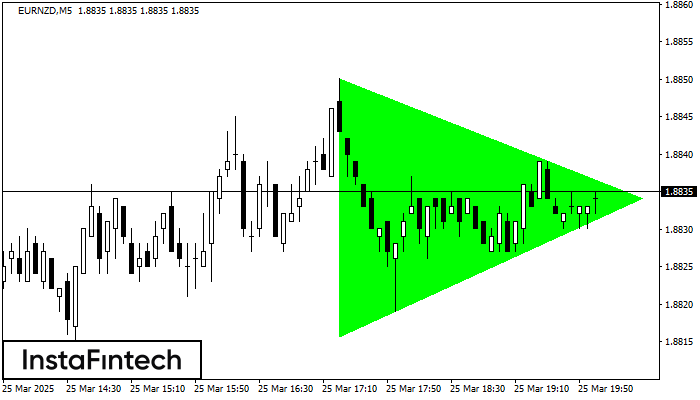
According to the chart of M5, EURNZD formed the Bullish Symmetrical Triangle pattern, which signals the trend will continue. Description. The upper border of the pattern touches the coordinates 1.8850/1.8834 whereas the lower border goes across 1.8816/1.8834. The pattern width is measured on the chart at 34 pips. If the Bullish Symmetrical Triangle pattern is in progress during the upward trend, this indicates the current trend will go on. In case 1.8834 is broken, the price could continue its move toward 1.8849.
The M5 and M15 time frames may have more false entry points.
- All
- Double Top
- Flag
- Head and Shoulders
- Pennant
- Rectangle
- Triangle
- Triple top
- All
- #AAPL
- #AMZN
- #Bitcoin
- #EBAY
- #FB
- #GOOG
- #INTC
- #KO
- #MA
- #MCD
- #MSFT
- #NTDOY
- #PEP
- #TSLA
- #TWTR
- AUDCAD
- AUDCHF
- AUDJPY
- AUDUSD
- EURCAD
- EURCHF
- EURGBP
- EURJPY
- EURNZD
- EURRUB
- EURUSD
- GBPAUD
- GBPCHF
- GBPJPY
- GBPUSD
- GOLD
- NZDCAD
- NZDCHF
- NZDJPY
- NZDUSD
- SILVER
- USDCAD
- USDCHF
- USDJPY
- USDRUB
- All
- M5
- M15
- M30
- H1
- D1
- All
- Buy
- Sale
- All
- 1
- 2
- 3
- 4
- 5
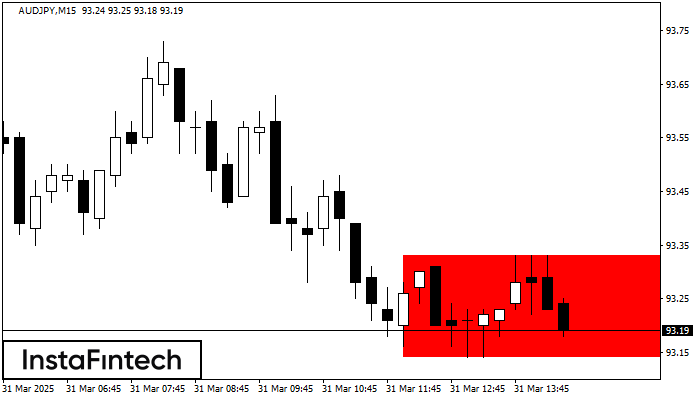
Theo biểu đồ của M15, AUDJPY đã tạo thành Hình chữ nhật giảm. Loại mô hình này cho thấy sự tiếp tục xu hướng
Khung thời gian M5 và M15 có thể có nhiều điểm vào lệnh sai hơn.
Open chart in a new window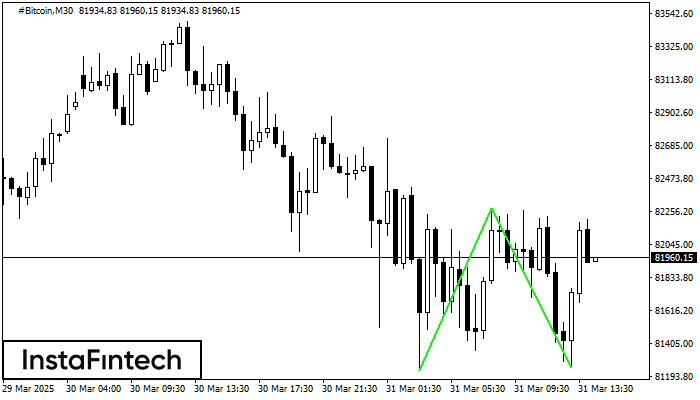
Mô hình Đáy đôi đã được hình thành trên #Bitcoin M30. Sự hình thành này báo hiệu sự đảo chiều của xu hướng từ dưới lên trên. Tín hiệu
Open chart in a new window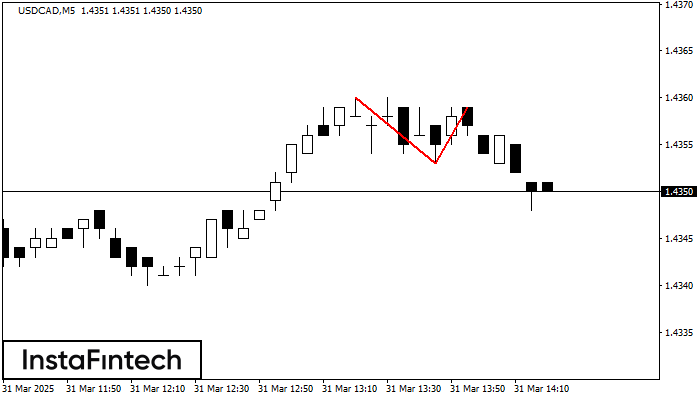
Trên biểu đồ USDCAD M5, mô hình đảo chiều Đỉnh đôi đã được hình thành. Đặc điểm: ranh giới trên ở 1.4359; ranh giới dưới ở 1.4353; chiều rộng
Khung thời gian M5 và M15 có thể có nhiều điểm vào lệnh sai hơn.
Open chart in a new window


