

signal strength 1 of 5
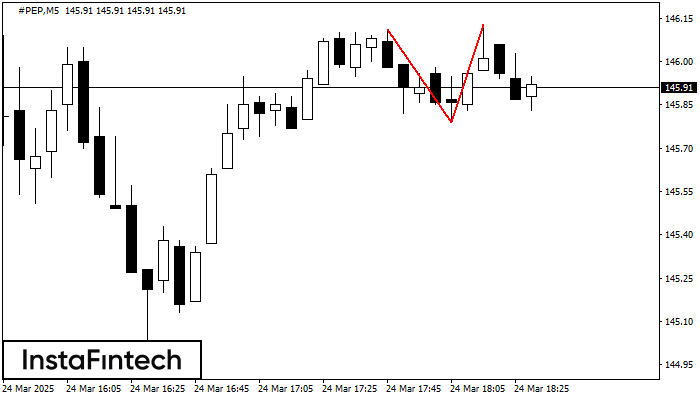
On the chart of #PEP M5 the Double Top reversal pattern has been formed. Characteristics: the upper boundary 146.13; the lower boundary 145.79; the width of the pattern 34 points. The signal: a break of the lower boundary will cause continuation of the downward trend targeting the 145.64 level.
The M5 and M15 time frames may have more false entry points.
- All
- Double Top
- Flag
- Head and Shoulders
- Pennant
- Rectangle
- Triangle
- Triple top
- All
- #AAPL
- #AMZN
- #Bitcoin
- #EBAY
- #FB
- #GOOG
- #INTC
- #KO
- #MA
- #MCD
- #MSFT
- #NTDOY
- #PEP
- #TSLA
- #TWTR
- AUDCAD
- AUDCHF
- AUDJPY
- AUDUSD
- EURCAD
- EURCHF
- EURGBP
- EURJPY
- EURNZD
- EURRUB
- EURUSD
- GBPAUD
- GBPCHF
- GBPJPY
- GBPUSD
- GOLD
- NZDCAD
- NZDCHF
- NZDJPY
- NZDUSD
- SILVER
- USDCAD
- USDCHF
- USDJPY
- USDRUB
- All
- M5
- M15
- M30
- H1
- D1
- All
- Buy
- Sale
- All
- 1
- 2
- 3
- 4
- 5
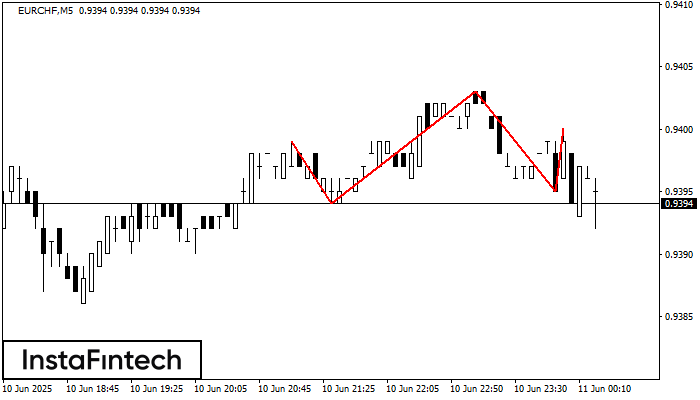
Графическая фигура «Голова и плечи» сформировалась по инструменту EURCHF на M5. Вероятно предполагать, что после формирования правого плеча цена преодолеет уровень шеи 0.9394/0.9395, изменяя тем самым тенденцию и фактически направляя
Таймфреймы М5 и М15 могут иметь больше ложных точек входа.
Открыть график инструмента в новом окне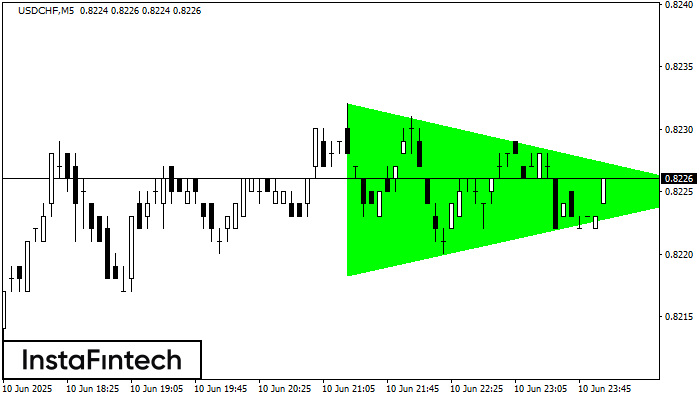
По USDCHF на M5 сформировалась фигура «Бычий симметричный треугольник». Нижняя граница фигуры имеет координаты 0.8218/0.8225, при этом верхняя граница 0.8232/0.8225. Формирование фигуры «Бычий симметричный треугольник» наиболее вероятным образом свидетельствует
Таймфреймы М5 и М15 могут иметь больше ложных точек входа.
Открыть график инструмента в новом окне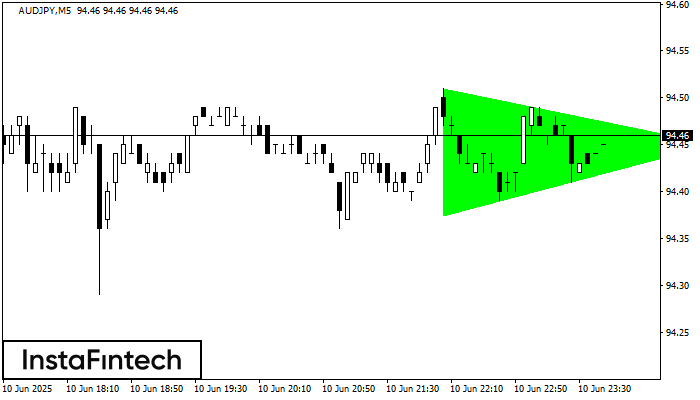
По AUDJPY на M5 сформировалась фигура «Бычий симметричный треугольник». Нижняя граница фигуры имеет координаты 94.37/94.45, при этом верхняя граница 94.51/94.45. Формирование фигуры «Бычий симметричный треугольник» наиболее вероятным образом свидетельствует
Таймфреймы М5 и М15 могут иметь больше ложных точек входа.
Открыть график инструмента в новом окне


