

signal strength 1 of 5
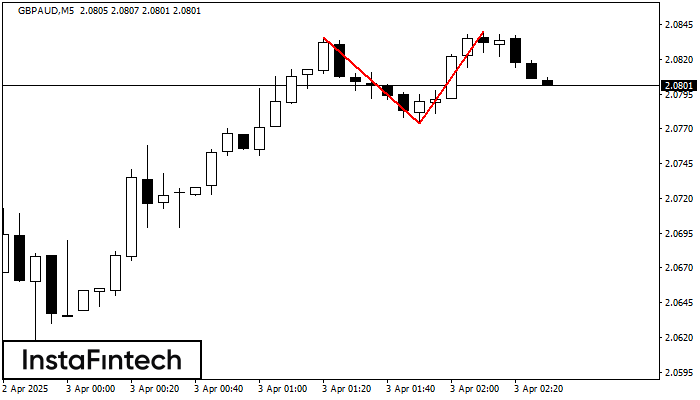
The Double Top reversal pattern has been formed on GBPAUD M5. Characteristics: the upper boundary 2.0836; the lower boundary 2.0774; the width of the pattern is 66 points. Sell trades are better to be opened below the lower boundary 2.0774 with a possible movements towards the 2.0759 level.
The M5 and M15 time frames may have more false entry points.
ดูเพิ่มเติม
- All
- Double Top
- Flag
- Head and Shoulders
- Pennant
- Rectangle
- Triangle
- Triple top
- All
- #AAPL
- #AMZN
- #Bitcoin
- #EBAY
- #FB
- #GOOG
- #INTC
- #KO
- #MA
- #MCD
- #MSFT
- #NTDOY
- #PEP
- #TSLA
- #TWTR
- AUDCAD
- AUDCHF
- AUDJPY
- AUDUSD
- EURCAD
- EURCHF
- EURGBP
- EURJPY
- EURNZD
- EURRUB
- EURUSD
- GBPAUD
- GBPCHF
- GBPJPY
- GBPUSD
- GOLD
- NZDCAD
- NZDCHF
- NZDJPY
- NZDUSD
- SILVER
- USDCAD
- USDCHF
- USDJPY
- USDRUB
- All
- M5
- M15
- M30
- H1
- D1
- All
- Buy
- Sale
- All
- 1
- 2
- 3
- 4
- 5
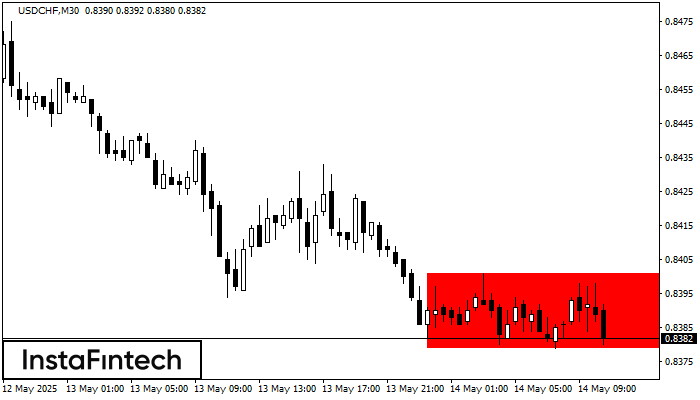
According to the chart of M30, USDCHF formed the Bearish Rectangle which is a pattern of a trend continuation. The pattern is contained within the following borders: lower border 0.8379
Open chart in a new window
According to the chart of M5, EURJPY formed the Inverse Head and Shoulder pattern. The Head’s top is set at 164.66 while the median line of the Neck is found
The M5 and M15 time frames may have more false entry points.
Open chart in a new window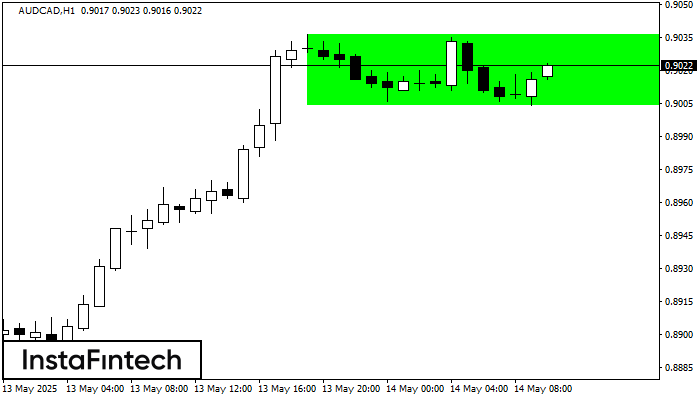
According to the chart of H1, AUDCAD formed the Bullish Rectangle. The pattern indicates a trend continuation. The upper border is 0.9036, the lower border is 0.9004. The signal means
Open chart in a new window


