


signal strength 1 of 5

According to the chart of M5, USDJPY formed the Bearish Rectangle. The pattern indicates a trend continuation. The upper border is 150.29, the lower border is 150.10. The signal means that a short position should be opened after fixing a price below the lower border 150.10 of the Bearish Rectangle.
The M5 and M15 time frames may have more false entry points.
ดูเพิ่มเติม
- All
- Double Top
- Flag
- Head and Shoulders
- Pennant
- Rectangle
- Triangle
- Triple top
- All
- #AAPL
- #AMZN
- #Bitcoin
- #EBAY
- #FB
- #GOOG
- #INTC
- #KO
- #MA
- #MCD
- #MSFT
- #NTDOY
- #PEP
- #TSLA
- #TWTR
- AUDCAD
- AUDCHF
- AUDJPY
- AUDUSD
- EURCAD
- EURCHF
- EURGBP
- EURJPY
- EURNZD
- EURRUB
- EURUSD
- GBPAUD
- GBPCHF
- GBPJPY
- GBPUSD
- GOLD
- NZDCAD
- NZDCHF
- NZDJPY
- NZDUSD
- SILVER
- USDCAD
- USDCHF
- USDJPY
- USDRUB
- All
- M5
- M15
- M30
- H1
- D1
- All
- Buy
- Sale
- All
- 1
- 2
- 3
- 4
- 5
was formed on 12.05 at 17:30:19 (UTC+0)
signal strength 1 of 5
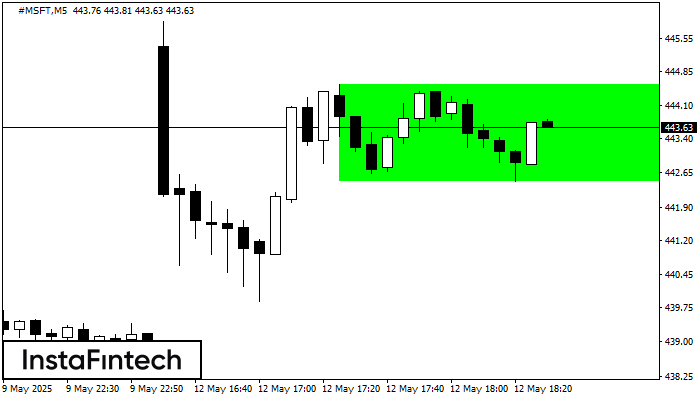
อ้างอิงจากชาร์ตของ M5, #MSFT ที่ได้สร้างรูปแบบ รูปแบบกราฟสี่เหลี่ยมผืนผ้าขาขึ้น (Bullish Rectangle) ออกมา รูปแบบนี้แสดงถึง ความต่อเนื่องในแนวโน้ม ขอบเขตด้านบนคือ 444.56 ส่วน ขอบเขตด้านล่างคือ 442.46
ขอบเตระยะเวลาใน M5 และ M15 อาจจะมีตำแหน่งการเข้าใช้งานที่ผิดพลาดมากยิ่งขึ้น
Open chart in a new window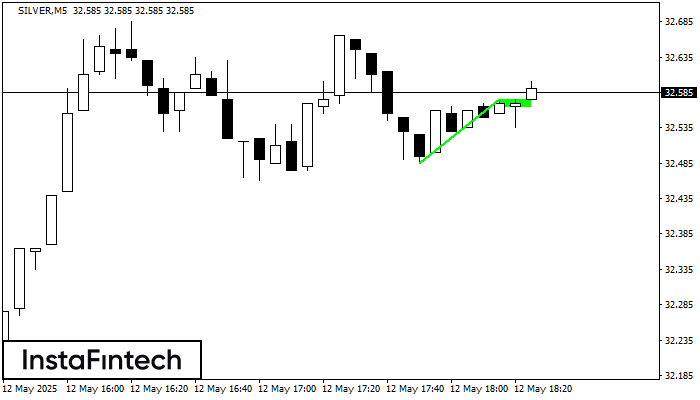
รูปแบบ รูปแบบกราฟธงขาขึ้น (Bullish Flag) ได้สร้างขึ้นมามาในชาร์ต SILVER M5 ซึ่งแสดงให้เห็นว่า แนวโน้มขาขึ้นจะเกิดขึ้นต่อไป สัญญาณ: การเคลื่อนตัวทะลุผ่านระดับสูงสุดที่ 32.58 อาจจะผลักดันราคาให้สูงขึ้นกว่าเดิม และการปรับตัวขึ้นจะเป็นระยะทางไปยังตัวเสา
ขอบเตระยะเวลาใน M5 และ M15 อาจจะมีตำแหน่งการเข้าใช้งานที่ผิดพลาดมากยิ่งขึ้น
Open chart in a new windowwas formed on 12.05 at 17:26:44 (UTC+0)
signal strength 1 of 5
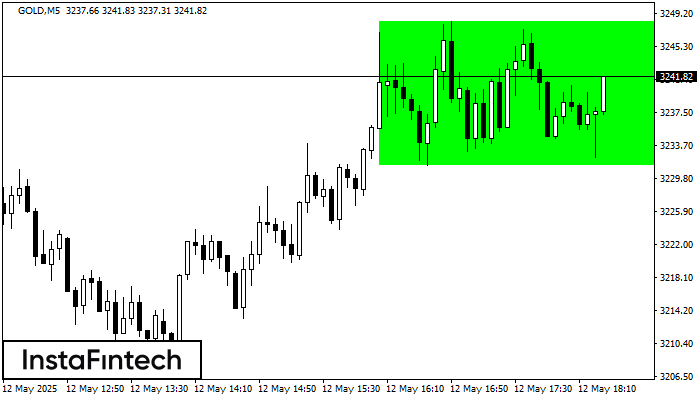
อ้างอิงจากชาร์ตของ M5, GOLD ที่ได้สร้างรูปแบบ รูปแบบกราฟสี่เหลี่ยมผืนผ้าขาขึ้น (Bullish Rectangle) ออกมา ซึ่งเป็นรูปแบบของความต่อเนื่องในแนวโน้ม รูปแบบนี้จะอยู่ในขอบเขตตามนี้: ขอบเขตด้านล่าง 3231.35 – 3231.35
ขอบเตระยะเวลาใน M5 และ M15 อาจจะมีตำแหน่งการเข้าใช้งานที่ผิดพลาดมากยิ่งขึ้น
Open chart in a new window


