


signal strength 2 of 5

The #Bitcoin M15 formed the Head and Shoulders pattern with the following features: The Head’s top is at 88742.88, the Neckline and the upward angle are at 87100.22/87010.53. The formation of this pattern can bring about changes in the current trend from bullish to bearish. In case the pattern triggers the expected changes, the price of #Bitcoin will go towards 87010.30.
The M5 and M15 time frames may have more false entry points.
ดูเพิ่มเติม
- All
- Double Top
- Flag
- Head and Shoulders
- Pennant
- Rectangle
- Triangle
- Triple top
- All
- #AAPL
- #AMZN
- #Bitcoin
- #EBAY
- #FB
- #GOOG
- #INTC
- #KO
- #MA
- #MCD
- #MSFT
- #NTDOY
- #PEP
- #TSLA
- #TWTR
- AUDCAD
- AUDCHF
- AUDJPY
- AUDUSD
- EURCAD
- EURCHF
- EURGBP
- EURJPY
- EURNZD
- EURRUB
- EURUSD
- GBPAUD
- GBPCHF
- GBPJPY
- GBPUSD
- GOLD
- NZDCAD
- NZDCHF
- NZDJPY
- NZDUSD
- SILVER
- USDCAD
- USDCHF
- USDJPY
- USDRUB
- All
- M5
- M15
- M30
- H1
- D1
- All
- Buy
- Sale
- All
- 1
- 2
- 3
- 4
- 5
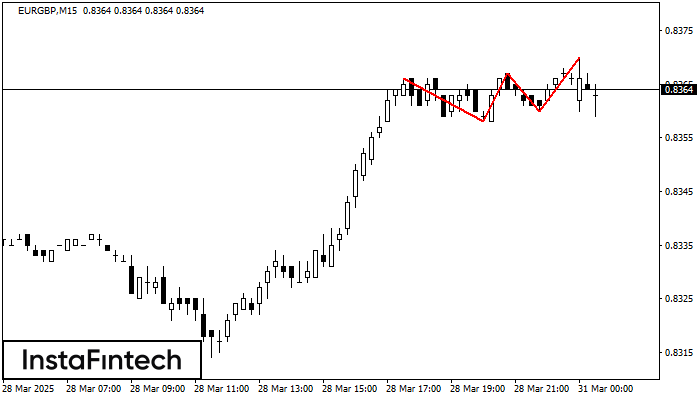
รูปแบบ รูปแบบกราฟจุดสามยอด (Triple Top) ได้สร้างขึ้นมาในชาร์ตของ EURGBP M15 คุณลักษณะของกราฟรูปแบบนี้: ขอบเขตมีมุมหงายขึ้น; เส้นด้านล่างของกราฟรูปแบบนี้มีพิกัดอยู่ที่ 0.8358/0.8360 พร้อมกับลิมิตขาขึ้น 0.8366/0.8370; ระยะของความกว้างคือ
ขอบเตระยะเวลาใน M5 และ M15 อาจจะมีตำแหน่งการเข้าใช้งานที่ผิดพลาดมากยิ่งขึ้น
Open chart in a new windowwas formed on 30.03 at 23:26:32 (UTC+0)
signal strength 1 of 5

รูปแบบ รูปแบบกราฟธงปลายแหลมขาลง (Bearish pennant) ได้สร้างขึ้นมาในชาร์ต AUDCHF M5 รูปแบบนี้แสดงถึงความต่องเนื่องของแนวโน้มขาลง กรณีที่มีการเคลื่อนตัวทะลุผ่านของระดับต่ำในรูปธงปลายแหลมที่ 0.5526 ออกไป คำแนะนำ: กำหนดคำสั่งซื้อขายล่วงหน้า(pending order)
ขอบเตระยะเวลาใน M5 และ M15 อาจจะมีตำแหน่งการเข้าใช้งานที่ผิดพลาดมากยิ่งขึ้น
Open chart in a new window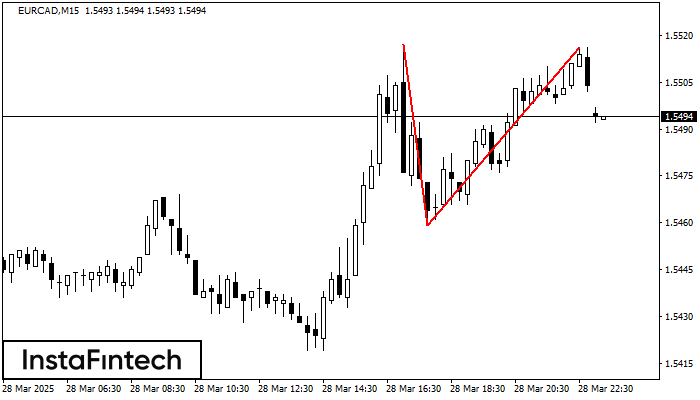
รูปแบบ รูปแบบกราฟจุดสองยอด (Double Top) ถูกสร้างขึ้นมาใน EURCAD M15 มันแสดงให้เห็นว่า แนวโน้มได้มีการเปลี่ยนแปลงจากแนวโน้มขาขึ้น ไปเป็นขาลง บางที ถ้ามีการเคลื่อนตัวทะลุผ่าน ฐานของรูปแบบออกไป 1.5459 การเคลื่อนไหวลงด้านล่างจะยังคงเกิดขึ้น
ขอบเตระยะเวลาใน M5 และ M15 อาจจะมีตำแหน่งการเข้าใช้งานที่ผิดพลาดมากยิ่งขึ้น
Open chart in a new window


