

signal strength 1 of 5
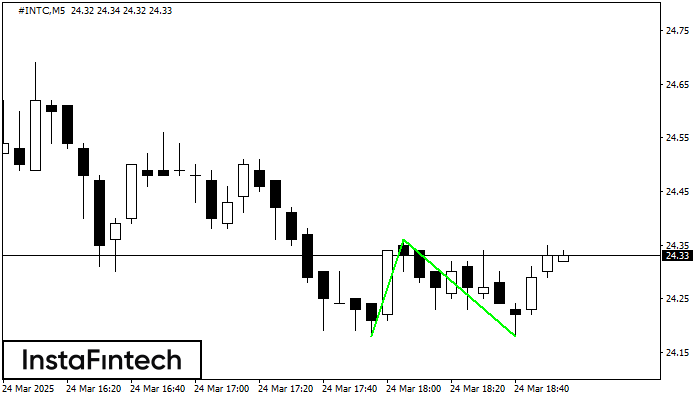
The Double Bottom pattern has been formed on #INTC M5. Characteristics: the support level 24.18; the resistance level 24.36; the width of the pattern 18 points. If the resistance level is broken, a change in the trend can be predicted with the first target point lying at the distance of 18 points.
The M5 and M15 time frames may have more false entry points.
- All
- Double Top
- Flag
- Head and Shoulders
- Pennant
- Rectangle
- Triangle
- Triple top
- All
- #AAPL
- #AMZN
- #Bitcoin
- #EBAY
- #FB
- #GOOG
- #INTC
- #KO
- #MA
- #MCD
- #MSFT
- #NTDOY
- #PEP
- #TSLA
- #TWTR
- AUDCAD
- AUDCHF
- AUDJPY
- AUDUSD
- EURCAD
- EURCHF
- EURGBP
- EURJPY
- EURNZD
- EURRUB
- EURUSD
- GBPAUD
- GBPCHF
- GBPJPY
- GBPUSD
- GOLD
- NZDCAD
- NZDCHF
- NZDJPY
- NZDUSD
- SILVER
- USDCAD
- USDCHF
- USDJPY
- USDRUB
- All
- M5
- M15
- M30
- H1
- D1
- All
- Buy
- Sale
- All
- 1
- 2
- 3
- 4
- 5
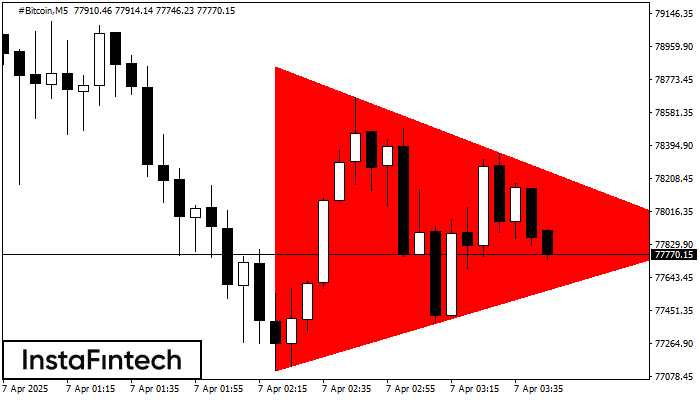
According to the chart of M5, #Bitcoin formed the Bearish Symmetrical Triangle pattern. Trading recommendations: A breach of the lower border 77111.27 is likely to encourage a continuation
The M5 and M15 time frames may have more false entry points.
Open chart in a new window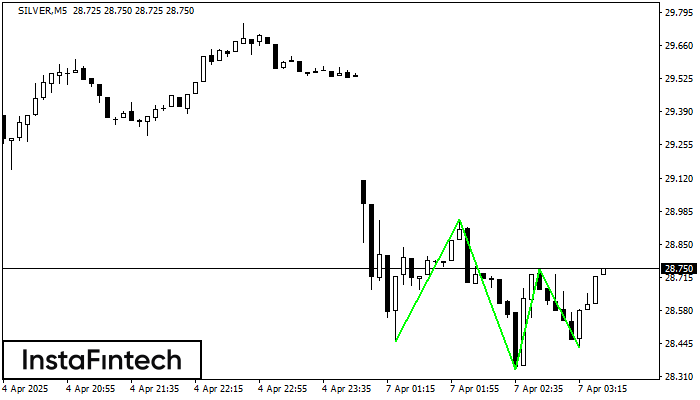
The Triple Bottom pattern has formed on the chart of SILVER M5. Features of the pattern: The lower line of the pattern has coordinates 28.95 with the upper limit 28.95/28.75
The M5 and M15 time frames may have more false entry points.
Open chart in a new window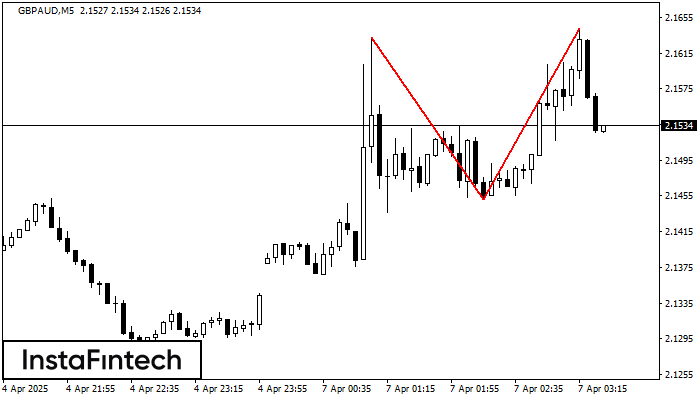
On the chart of GBPAUD M5 the Double Top reversal pattern has been formed. Characteristics: the upper boundary 2.1642; the lower boundary 2.1451; the width of the pattern 191 points
The M5 and M15 time frames may have more false entry points.
Open chart in a new window


