empty
06.10.2021 07:35 AM
How to use technical indicators when trading ETH/USD

Ether is currently the second-largest digital currency by market capitalization after bitcoin. Many experts think that ether has far more advantages than bitcoin. Yet, one should choose completely different strategies when trading these digital assets despite some similar features between them. The growth rate of ether is significantly higher compared to bitcoin. It is associated with different groups of traders that buy these altcoins. Support levels in the crypto market are formed in another way as well as breakouts of resistance levels. However, to start trading ETH/USD, it is necessary to use familiar technical indicators on the horizontal charts.

The Relative Strength Index (RSI) is a technical indicator that allows traders to determine the force of a trend (descending or ascending) and foresee possible changes in the price movement. Thanks to this indicator, it is possible to identify at what level an asset will become overbought or oversold. The optimal level for this indicator is 60 if we need a bullish trend. It indicates a high demand for the coin and the strength of the current upward momentum. When crossing this level, the digital asset begins to move to the overbought zone.

The moving average convergence divergence (MACD) is a popular technical momentum indicator that helps traders draw certain conclusions about the trend based on the movement of moving averages and the relation between the two moving averages. It signals bullish momentum when the intersection of the white line under the red occurs. It indicates bearish momentum when the white line from above crosses the red.

A stochastic Oscillator, also referred to as a Stochastic Indicator, is a momentum indicator that helps determine the direction of the prevailing trend. If the indicator is above the 80 level, then the asset is overbought. If it is below 20, then the asset is oversold.

Notably, demand for ether among retail traders is growing thanks to several reasons. Firstly, it is not as institutionalized as BTC, which helps ether lesser dependence on the flows of large capital. In addition, the speed and security of transactions on the ETH network are much better than that of bitcoin. The recent London hard fork update has significantly reduced the size of commissions, attracting a large number of individual traders. The main advantage of ether is a developed ecosystem that allows using the capabilities of the DeFi and NFT market. Ether managed to increase transaction volumes by 260% amid these developments.

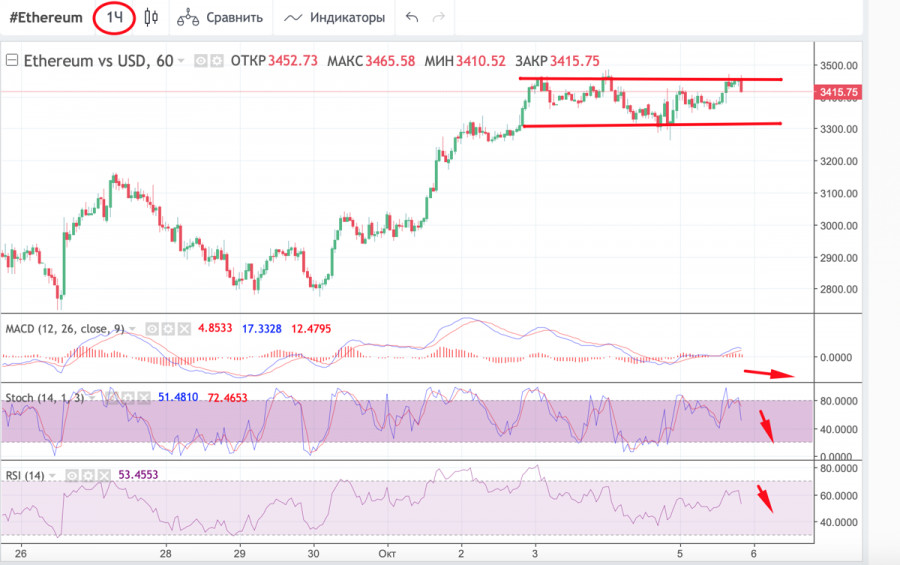
As of October 5, ETH/USD was trading at $3,400. Analysts are sure that ether is likely to reach a new all-time high amid positive sentiment in the crypto market. Analysis of technical charts helps you to determine the main trend of the cryptocurrency by looking at what level it is located. Technical indicators may also provide clues on how long it takes for the digital asset to reach a new high. The 1H chart shows that the altcoin has been consolidating since early October. It struggles to break through the $3,500 level due to a big number of short positions orders after the recent market collapse.

The $3,500 level is the lower limit of the resistance zone, which ends after the digital asset reaches $3,650. When the cryptocurrency breaks out of this area, an upward movement will begin to the next resistance level near $4,000. On the 1H chart, technical indicators signal a downward movement. The stochastic oscillator shows a strong bearish signal. It fell below the 50 mark. The MACD indicator is also close to forming a bearish intersection, which indicates the weakness of bulls. It seems that traders stick to the wait-and-see approach.
This image is no longer relevant

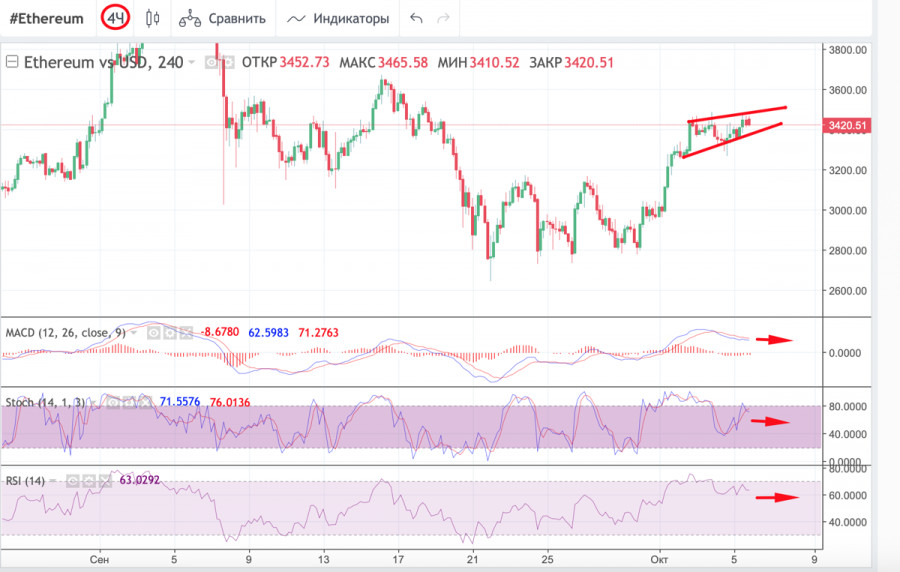
On the 4H chart, the indicators have stabilized. They signal the accumulation phase, which may lead to a possible breakout of $3,500 tonight. However, traders are concerned by the formation of a bearish wedge on the charts, which may indicate a decline. This is why the virtual asset is unlikely to break through the $3,500 mark. It means that the altcoin will remain within the accumulation zone. At the same time, the MACD and the RSI index are moving sideways, which indicates the absence of strong bullish or bearish momentum. However, taking into account the formation of a bearish figure, bears are likely to gain momentum. Stochastic continues to move up. At the same time, it signals the weakness of the bullish momentum and the formed bullish intersection is unlikely to change the situation.

This image is no longer relevant

A wedge pattern can signal either bullish or bearish price reversals on the horizontal charts. It indicates that the price has reached local highs followed by a further price drop or trend reversal.

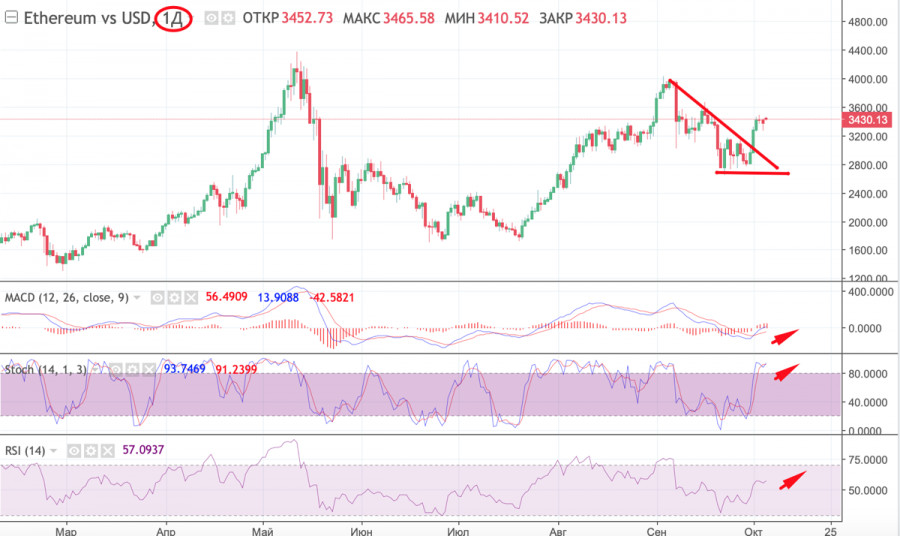
The bearish triangle or descending triangle is a bearish formation on the horizontal charts that anticipates a downside breakout. Ascending triangles are a bullish formation that anticipates an upside breakout.

On the daily chart, ETH/USD went beyond the bearish triangle. Now, the price is trying to consolidate above this zone. however, the dominance of bears can be seen on smaller timeframes. However, the technical indicators show that the consolidation phase is coming to an end. The MACD indicator has entered the red zone. Yet, it continues to grow, as does the stochastic, which has formed a bullish intersection. It is moving above the 80 mark. At the same time, the RSI indicator began a sideways movement along the 60 mark. It signals a possible strengthening of the current bullish momentum. However, in general, technical indicators show a correctional phase that will begin in the near future. After the correctional phase, the price will try to break above $3,500. It may rise on October 6. So, it is recommended to open long traders on ETH with prospects of growth above $4,000.

This image is no longer relevant

เลือกช่วงเวลา
5
นาที
15
นาที
30
นาที
1
ชั่วโมง
4
ชั่วโมง
1
วัน
1
สัปดาห์
รับผลกำไรจากการเปลี่ยนแปลงอัตราสกุลเงินดิจิทัลกับ InstaForex.
ดาวน์โหลด MetaTrader 4 และเปิดการซื้อขายครั้งแรกของคุณ.
USD/CAD: การวิเคราะห์และการพยากรณ์ คู่เงิน USD/CAD ได้ฟื้นตัวเป็นวันที่สามติดต่อกันจากระดับต่ำสุดในปีนี้ ได้รับการสนับสนุนจากความสนใจในการซื้อเงินดอลลาร์สหรัฐที่เพิ่มขึ้น ข้อมูลเศรษฐกิจสหรัฐที่ออกมามีความหวังเมื่อวานนี้ช่วยให้ภาวะเศรษฐกิจถดถอยผ่อนคลายลง และสนับสนุนดัชนีดอลลาร์ DXY ส่งผลในเชิงบวกต่อคู่เงิน USD/CAD อย่างไรก็ตาม การรวมตัวของปัจจัยต้องการความระมัดระวังจากนักลงทุนที่หวังในแนวโน้มการเติบโตของดอลลาร์ นักลงทุนยังคงระวังเกี่ยวกับความกังวลที่เพิ่มขึ้นเกี่ยวกับมุมมองด้านการคลังที่เสื่อมโทรมของสหรัฐ คาดการณ์ยังมีเพิ่มขึ้นว่าธนาคารกลางสหรัฐอาจลดอัตราดอกเบี้ยอย่างน้อยสองครั้งในปี 2025 ซึ่งอาจจำกัดศักยภาพการขึ้นของทั้งดอลลาร์สหรัฐและคู่เงิน
  • Grand Choice
    Contest by
    InstaForex
    InstaForex always strives to help you
    fulfill your biggest dreams.
    เข้าร่วมการแข่งขัน


บทความแนะนำ

คำแนะนำในการซื้อขายสำหรับตลาดคริปโตเคอเรนซีในวันที่ 28 พฤษภาคม

Bitcoin ไม่สามารถรักษาระดับเหนือ $110,000 ได้ ในขณะที่ Ethereum แสดงการเติบโตที่ดีอีกครั้ง หนุนโดยข่าวเกี่ยวกับความเป็นไปได้ในการเพิ่มขีดจำกัดก๊าซต่อบล็อกในบล็อกเชนอย่างมีนัยสำคัญ เมื่อวานนี้ หัวข้อเกี่ยวกับทุนสำรอง Bitcoin ของสหรัฐอเมริกาได้ถูกพูดถึงอีกครั้งในตลาด Bo Hines ผู้อำนวยการฝ่ายสินทรัพย์ดิจิตอลของประธานาธิบดีทรัมป์

Miroslaw Bawulski 10:04 2025-05-28 UTC+2

บิทคอยน์ยังคงอยู่ในช่วงที่เอื้อต่อการเติบโต

เมื่อวานนี้ Bitcoin และ Ethereum ยังคงดึงดูดความต้องการจากนักเทรดและนักลงทุน โดยรักษาความคาดหวังที่ดีในตลาดขาขึ้นต่อไป ในขณะเดียวกัน กองทุนการเงินระหว่างประเทศ (IMF) ได้กล่าวว่า จะพยายามเพื่อให้ปริมาณ Bitcoin ที่รัฐบาลเอลซัลวาดอร์ถือครองอยู่คงที่ ท่าทีนี้ขัดแย้งกับการเรียกร้องอย่างต่อเนื่องของประธานาธิบดี Nayib

Jakub Novak 09:36 2025-05-28 UTC+2

วิเคราะห์ทางเทคนิคการเคลื่อนไหวของราคาคู่สกุลเงินดิจิทัล Bitcoin ในระหว่างวัน พุธที่ 21 พฤษภาคม 2025

ในกราฟ 4 ชั่วโมงของสกุลเงินดิจิทัล Bitcoin พบว่ามีการเกิด Divergence ระหว่างการเคลื่อนไหวของราคาบิทคอยน์กับตัวบ่งชี้ Stochastic Oscillator ซึ่งบ่งชี้ว่าในอนาคตอันใกล้มีศักยภาพที่ราคาบิทคอยน์จะลดลงต่อเนื่อง โดยระดับ 107449.28 จะได้รับการทดสอบ หากระดับแนวรับนี้ถูกทะลุผ่านไปได้และบิทคอยน์ปิดต่ำกว่าระดับดังกล่าว มีโอกาสที่

Arief Makmur 08:39 2025-05-28 UTC+2

Bitcoin: การเดิมพันที่ $300,000 หรือการปรับฐานอันเจ็บปวด? ต่อไปนี้ตลาดจะเป็นอย่างไร

บิทคอยน์พุ่งขึ้นถึง $110,000 แต่ไม่สามารถรักษาระดับการพุ่งได้ตลอดทั้งวัน โดยยังคงอยู่ในช่วงการปรับฐาน อย่างไรก็ตาม การหยุดพักนาน ๆ แบบนี้ไม่ใช่สัญญาณของการหมดแรง ด้านหลังฉาก กิจกรรมยังคงคึกคัก: สถาบันต่าง ๆ กำลังซื้อ

Ekaterina Kiseleva 00:44 2025-05-28 UTC+2

Bitcoin และ Ethereum ยังคงมีแรงผลักดันในทิศทางขาขึ้น

แม้ว่าอาจจะมีการหยุดชั่วคราวบ้าง แต่ Bitcoin และ Ethereum ดูเหมือนจะยังไม่สิ้นสุดแนวโน้มขาขึ้นของพวกเขา ในขณะที่ Bitcoin มีการถอยกลับเล็กน้อยในช่วงการซื้อขายในเอเชียวันนี้ Ethereum ได้ทำลายสถิติใหม่ไปสู่จุดสูงสุดรายสัปดาห์แล้ว เหตุผลหนึ่งที่อาจอยู่เบื้องหลังการเข้าซื้อเมื่อวานนี้อาจเป็นข่าวลือว่า Trump Media

Jakub Novak 11:03 2025-05-27 UTC+2

บทวิเคราะห์ BTC/USD วันที่ 27 พฤษภาคม 2025

รูปแบบกราฟในกรอบเวลาสี่ชั่วโมงของ BTC/USD เริ่มมีความซับซ้อนมากขึ้นแล้ว โครงสร้างการปรับฐานลงได้สิ้นสุดการก่อตัวที่ระดับประมาณ $75,000 หลังจากนั้นการเคลื่อนไหวขาขึ้นที่ค่อนข้างแข็งแกร่งก็เริ่มต้นขึ้น ซึ่งอาจจะเป็นสัญญาณของแนวโน้มขาขึ้นแบบแรงดัน ในช่วงที่สองของส่วนนี้ดูค่อนข้างสั้นและไม่มั่นคงนัก แต่ความต้องการใน Bitcoin ยังคงเติบโตเรื่อยๆ ซึ่งเป็นสัญญาณของ 'การกระตุ้น' สถานการณ์ข่าวสนับสนุน Bitcoin

Chin Zhao 10:53 2025-05-27 UTC+2

คำแนะนำการซื้อขายสำหรับตลาดคริปโตเคอร์เรนซีในวันที่ 27 พฤษภาคม

ความต้องการสำหรับ bitcoin และ ether ยังคงมีต่อเนื่องในช่วงต้นสัปดาห์นี้ Bitcoin ยังคงอยู่เหนือระดับ $109,000 ขณะที่ Ethereum กำลังพยายามประคองที่ระดับเหนือ $2,600 ข่าวเมื่อวานที่ว่า Strategy ได้ดำเนินการซื้อ

Miroslaw Bawulski 08:53 2025-05-27 UTC+2

บิทคอยน์ยังคงอยู่เหนือ $107,000

บิทคอยน์กลับมาขยับขึ้นอีกครั้งและได้ทะลุระดับ $109,900 แล้ว หลังจากการปรับฐานที่ระดับ $106,000 เมื่อช่วงสุดสัปดาห์ที่ผ่านมา การที่ราคายังยืนเหนือระดับ $107,000 ได้และฟื้นตัวขึ้นอย่างแข็งแกร่งจากระดับนั้น ทำให้มีมุมมองเชิงบวกต่อตลาดสกุลเงินดิจิทัล ระดับราคานี้ได้กลายเป็นเขตการสนับสนุนที่สำคัญอย่างชัดเจน บ่งบอกว่าผู้ซื้อกำลังเข้าสู่ตลาดอย่างแข็งขันเพื่อป้องกันการลดลงเพิ่มเติม สถานการณ์ตลาดที่มีแนวโน้มบวกยังได้รับการสนับสนุนโดยปัจจัยสำคัญหลายประการ ประการแรก ความสนใจของสถาบันในคริปโตเคอร์เรนซี

Jakub Novak 11:35 2025-05-26 UTC+2

คำแนะนำการซื้อขายสำหรับตลาดคริปโตเคอเรนซีในวันที่ 26 พฤษภาคม

ความต้องการสำหรับ Bitcoin และ Ethereum ได้กลับมาเพิ่มขึ้นอีกครั้งในช่วงต้นสัปดาห์นี้ Bitcoin ได้ทะลุระดับ $109,000 ขึ้นไปแล้ว ในขณะที่ Ethereum กำลังพยายามรวบรวมกำลังเพื่อยืนอยู่เหนือระดับ $2,550 เมื่อวานนี้ Paolo

Miroslaw Bawulski 09:39 2025-05-26 UTC+2

บิทคอยน์ วันที่ 23 พฤษภาคม การวิเคราะห์ระบบสมาร์ทมันนี่

บิทคอยน์ยังคงสร้างโครงสร้างแนวโน้มกระทิงต่อเนื่อง อาจมีข้อถกเถียงได้ว่าในขณะนี้มีเหตุผลจริงในการสร้างแนวโน้มกระทิงรอบใหม่หรือไม่ แต่จากชาร์ตนั้นบ่งบอกอย่างชัดเจนเท่านั้น—อย่างไม่มีข้อกังขา เพราะว่าขณะนี้มีการสร้างคลื่นขาขึ้นขึ้นมา เทรดเดอร์สามารถทำได้เพียงรอให้ราคาย่างก้าวเข้าสู่โซนที่สนใจเพื่อให้มีโอกาสเข้าซื้อในทิศทางขาขึ้น ซึ่งโซนเหล่านี้คือ Imbalance 3 และ 4 การกลับไปยังพื้นที่ที่เกิดภาวะไม่สมดุลจะหมายถึงตลาดได้ปรับราคาสมดุลแล้ว จากนั้นการเติบโตของ Bitcoin อาจดำเนินต่อไป สำหรับผม

Samir Klishi 20:04 2025-05-23 UTC+2
หากไม่สะดวกคุยในตอนนี้
ระบุคำถามไว้ได้ใน แชท.
Widget callback
 

Dear visitor,

Your IP address shows that you are currently located in the USA. If you are a resident of the United States, you are prohibited from using the services of InstaFintech Group including online trading, online transfers, deposit/withdrawal of funds, etc.

If you think you are seeing this message by mistake and your location is not the US, kindly proceed to the website. Otherwise, you must leave the website in order to comply with government restrictions.

Why does your IP address show your location as the USA?

  • - you are using a VPN provided by a hosting company based in the United States;
  • - your IP does not have proper WHOIS records;
  • - an error occurred in the WHOIS geolocation database.

Please confirm whether you are a US resident or not by clicking the relevant button below. If you choose the wrong option, being a US resident, you will not be able to open an account with InstaForex anyway.

We are sorry for any inconvenience caused by this message.