

signal strength 1 of 5
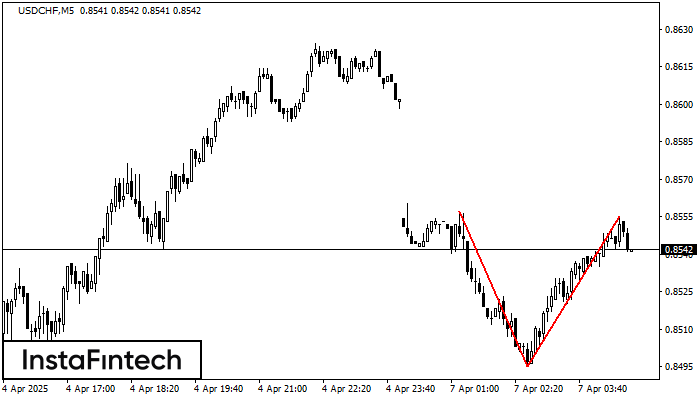
On the chart of USDCHF M5 the Double Top reversal pattern has been formed. Characteristics: the upper boundary 0.8555; the lower boundary 0.8495; the width of the pattern 60 points. The signal: a break of the lower boundary will cause continuation of the downward trend targeting the 0.8480 level.
The M5 and M15 time frames may have more false entry points.
- All
- Double Top
- Flag
- Head and Shoulders
- Pennant
- Rectangle
- Triangle
- Triple top
- All
- #AAPL
- #AMZN
- #Bitcoin
- #EBAY
- #FB
- #GOOG
- #INTC
- #KO
- #MA
- #MCD
- #MSFT
- #NTDOY
- #PEP
- #TSLA
- #TWTR
- AUDCAD
- AUDCHF
- AUDJPY
- AUDUSD
- EURCAD
- EURCHF
- EURGBP
- EURJPY
- EURNZD
- EURRUB
- EURUSD
- GBPAUD
- GBPCHF
- GBPJPY
- GBPUSD
- GOLD
- NZDCAD
- NZDCHF
- NZDJPY
- NZDUSD
- SILVER
- USDCAD
- USDCHF
- USDJPY
- USDRUB
- All
- M5
- M15
- M30
- H1
- D1
- All
- Buy
- Sale
- All
- 1
- 2
- 3
- 4
- 5
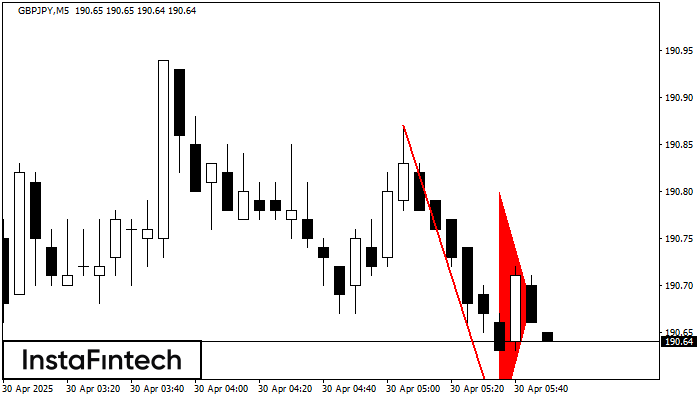
El patrón Banderín bajista se ha formado en el gráfico GBPJPY M5. El patrón señala la continuación de la tendencia bajista en caso de que se rompa el mínimo
Los marcos de tiempo M5 y M15 pueden tener más puntos de entrada falsos.
Open chart in a new window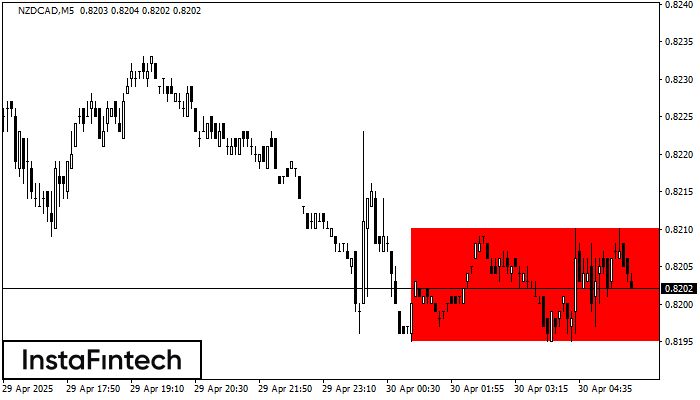
Según el gráfico de M5, NZDCAD formó el Rectángulo Bajista. El patrón indica la continuación de una tendencia. El límite superior es 0.8210, el límite inferior es 0.8195. La señal
Los marcos de tiempo M5 y M15 pueden tener más puntos de entrada falsos.
Open chart in a new window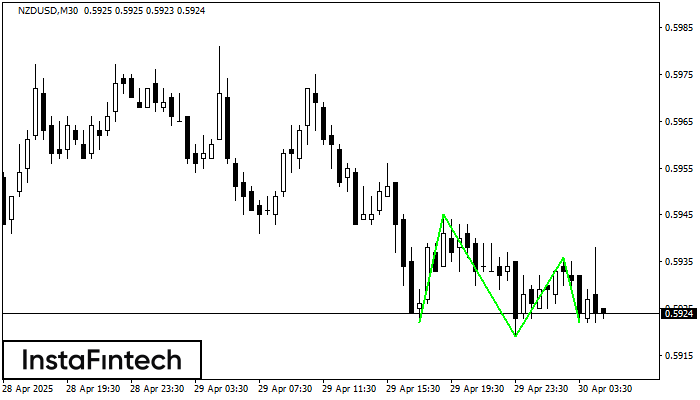
El patrón Triple Piso ha sido formado en NZDUSD M30. Este tiene las siguientes características: nivel de resistencia 0.5945/0.5936; nivel de soporte 0.5922/0.5922; el ancho es 23 puntos. En caso
Open chart in a new window


