

signal strength 2 of 5
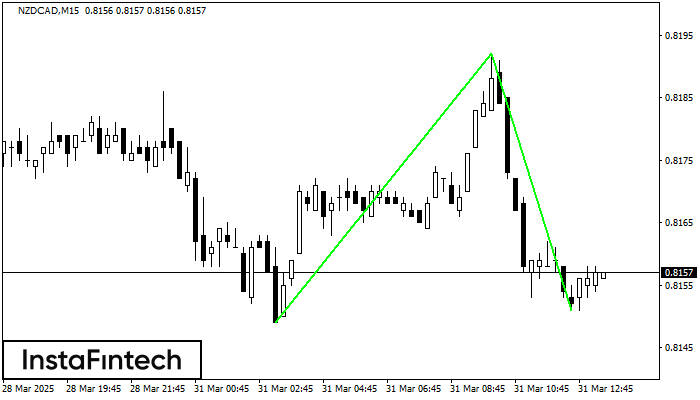
The Double Bottom pattern has been formed on NZDCAD M15. Characteristics: the support level 0.8149; the resistance level 0.8192; the width of the pattern 43 points. If the resistance level is broken, a change in the trend can be predicted with the first target point lying at the distance of 41 points.
The M5 and M15 time frames may have more false entry points.
Vea asimismo
- All
- Double Top
- Flag
- Head and Shoulders
- Pennant
- Rectangle
- Triangle
- Triple top
- All
- #AAPL
- #AMZN
- #Bitcoin
- #EBAY
- #FB
- #GOOG
- #INTC
- #KO
- #MA
- #MCD
- #MSFT
- #NTDOY
- #PEP
- #TSLA
- #TWTR
- AUDCAD
- AUDCHF
- AUDJPY
- AUDUSD
- EURCAD
- EURCHF
- EURGBP
- EURJPY
- EURNZD
- EURRUB
- EURUSD
- GBPAUD
- GBPCHF
- GBPJPY
- GBPUSD
- GOLD
- NZDCAD
- NZDCHF
- NZDJPY
- NZDUSD
- SILVER
- USDCAD
- USDCHF
- USDJPY
- USDRUB
- All
- M5
- M15
- M30
- H1
- D1
- All
- Buy
- Sale
- All
- 1
- 2
- 3
- 4
- 5
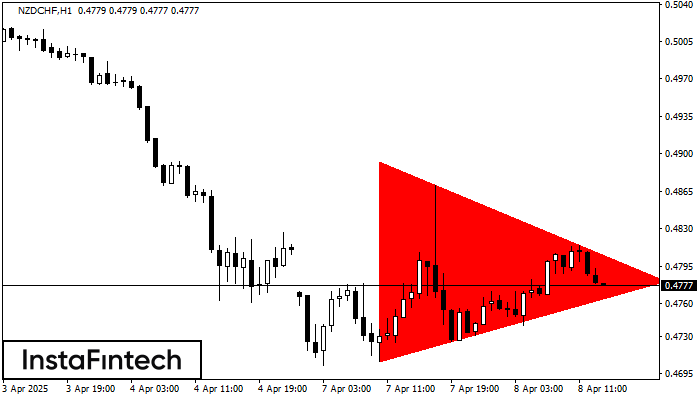
Según el gráfico de H1, el NZDCHF formó el patrón Triángulo Simétrico Bajista. Este patrón señala una tendencia bajista en caso de que el límite inferior 0.4706 sea roto. Aquí
Open chart in a new window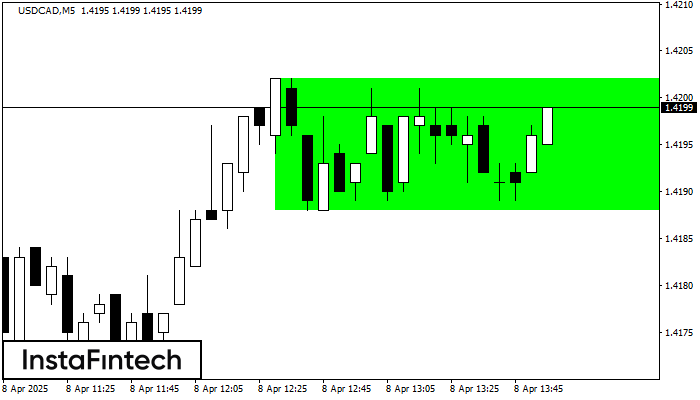
Según el gráfico de M5, USDCAD formó el Rectángulo Alcista que es un patrón de la continuación de una tendencia. El patrón está contenido dentro de los siguientes límites
Los marcos de tiempo M5 y M15 pueden tener más puntos de entrada falsos.
Open chart in a new window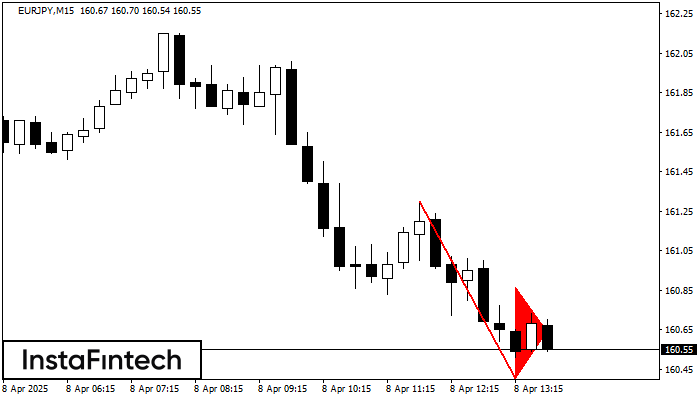
El patrón Banderín bajista se ha formado en el gráfico EURJPY M15. Esto señala la continuación potencial de la tendencia existente. Especificaciones: el piso del patrón tiene la coordinada
Los marcos de tiempo M5 y M15 pueden tener más puntos de entrada falsos.
Open chart in a new window


