

signal strength 1 of 5
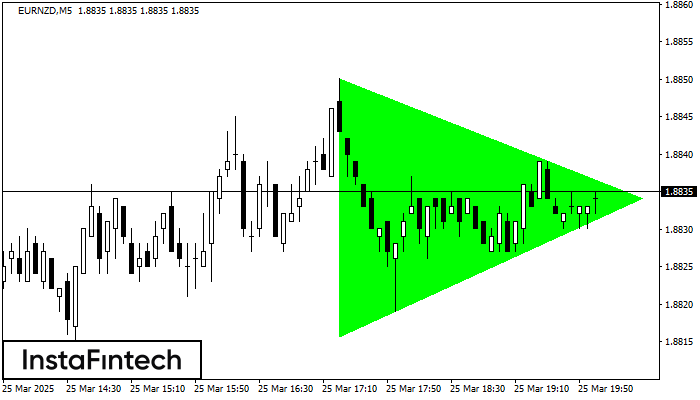
According to the chart of M5, EURNZD formed the Bullish Symmetrical Triangle pattern, which signals the trend will continue. Description. The upper border of the pattern touches the coordinates 1.8850/1.8834 whereas the lower border goes across 1.8816/1.8834. The pattern width is measured on the chart at 34 pips. If the Bullish Symmetrical Triangle pattern is in progress during the upward trend, this indicates the current trend will go on. In case 1.8834 is broken, the price could continue its move toward 1.8849.
The M5 and M15 time frames may have more false entry points.
Vea asimismo
- All
- Double Top
- Flag
- Head and Shoulders
- Pennant
- Rectangle
- Triangle
- Triple top
- All
- #AAPL
- #AMZN
- #Bitcoin
- #EBAY
- #FB
- #GOOG
- #INTC
- #KO
- #MA
- #MCD
- #MSFT
- #NTDOY
- #PEP
- #TSLA
- #TWTR
- AUDCAD
- AUDCHF
- AUDJPY
- AUDUSD
- EURCAD
- EURCHF
- EURGBP
- EURJPY
- EURNZD
- EURRUB
- EURUSD
- GBPAUD
- GBPCHF
- GBPJPY
- GBPUSD
- GOLD
- NZDCAD
- NZDCHF
- NZDJPY
- NZDUSD
- SILVER
- USDCAD
- USDCHF
- USDJPY
- USDRUB
- All
- M5
- M15
- M30
- H1
- D1
- All
- Buy
- Sale
- All
- 1
- 2
- 3
- 4
- 5

Según el gráfico de M5, GBPAUD formó el patrón. El techo de la Cabeza está establecido en 2.0644 mientras la línea media del Cuello se encuentra en 2.0617/2.0613. La formación
Los marcos de tiempo M5 y M15 pueden tener más puntos de entrada falsos.
Open chart in a new window
El patrón Triple Techo ha sido formado en el gráfico de EURCAD M30. Características del patrón: los límites tienen un ángulo ascendente, la línea inferior del patrón tiene coordenadas 1.5476/1.5505
Open chart in a new window
El patrón técnico llamado Cabeza y Hombros ha aparecido en el gráfico de EURGBP M30. Existen razones poderosas para sugerir que el precio superará la línea de cuello 0.8358/0.8357 después
Open chart in a new window


