


signal strength 2 of 5
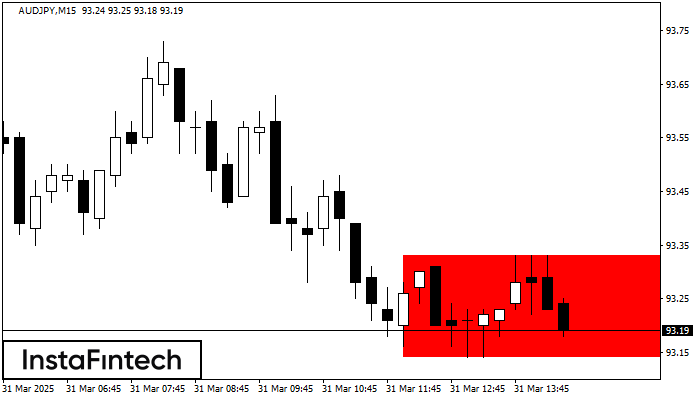
According to the chart of M15, AUDJPY formed the Bearish Rectangle. This type of a pattern indicates a trend continuation. It consists of two levels: resistance 93.33 - 0.00 and support 93.14 – 93.14. In case the resistance level 93.14 - 93.14 is broken, the instrument is likely to follow the bearish trend.
The M5 and M15 time frames may have more false entry points.
- All
- Double Top
- Flag
- Head and Shoulders
- Pennant
- Rectangle
- Triangle
- Triple top
- All
- #AAPL
- #AMZN
- #Bitcoin
- #EBAY
- #FB
- #GOOG
- #INTC
- #KO
- #MA
- #MCD
- #MSFT
- #NTDOY
- #PEP
- #TSLA
- #TWTR
- AUDCAD
- AUDCHF
- AUDJPY
- AUDUSD
- EURCAD
- EURCHF
- EURGBP
- EURJPY
- EURNZD
- EURRUB
- EURUSD
- GBPAUD
- GBPCHF
- GBPJPY
- GBPUSD
- GOLD
- NZDCAD
- NZDCHF
- NZDJPY
- NZDUSD
- SILVER
- USDCAD
- USDCHF
- USDJPY
- USDRUB
- All
- M5
- M15
- M30
- H1
- D1
- All
- Buy
- Sale
- All
- 1
- 2
- 3
- 4
- 5
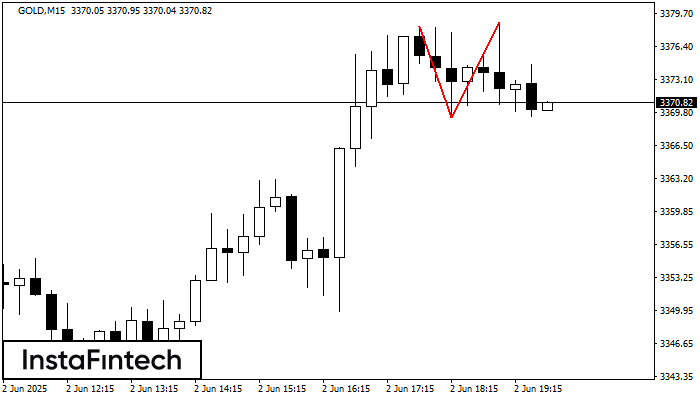
On the chart of GOLD M15 the Double Top reversal pattern has been formed. Characteristics: the upper boundary 3378.88; the lower boundary 3369.32; the width of the pattern 956 points
The M5 and M15 time frames may have more false entry points.
Open chart in a new window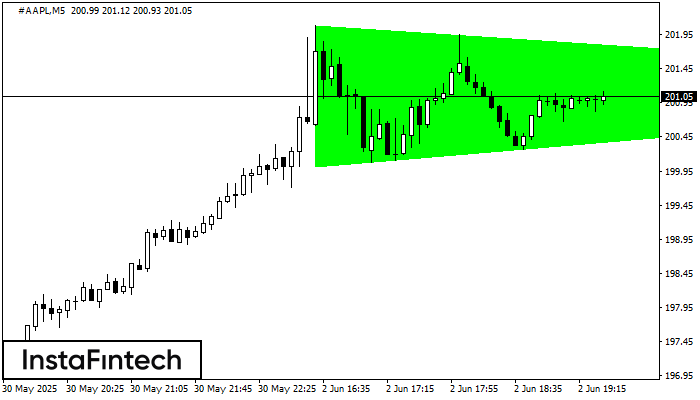
According to the chart of M5, #AAPL formed the Bullish Symmetrical Triangle pattern. The lower border of the pattern touches the coordinates 200.01/201.18 whereas the upper border goes across 202.09/201.18
The M5 and M15 time frames may have more false entry points.
Open chart in a new window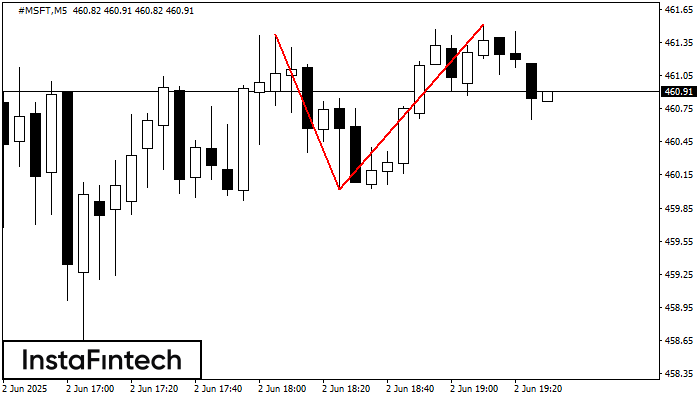
On the chart of #MSFT M5 the Double Top reversal pattern has been formed. Characteristics: the upper boundary 461.51; the lower boundary 460.02; the width of the pattern 149 points
The M5 and M15 time frames may have more false entry points.
Open chart in a new window


