


signal strength 2 of 5
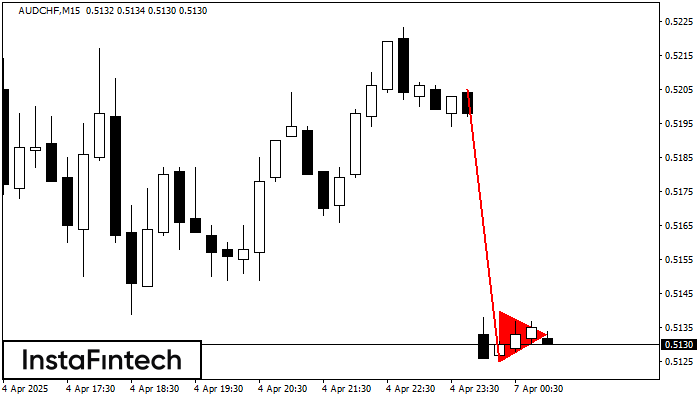
The Bearish pennant pattern has formed on the AUDCHF M15 chart. It signals potential continuation of the existing trend. Specifications: the pattern’s bottom has the coordinate of 0.5125; the projection of the flagpole height is equal to 80 pips. In case the price breaks out the pattern’s bottom of 0.5125, the downtrend is expected to continue for further level 0.5102.
The M5 and M15 time frames may have more false entry points.
Veja também
- All
- Double Top
- Flag
- Head and Shoulders
- Pennant
- Rectangle
- Triangle
- Triple top
- All
- #AAPL
- #AMZN
- #Bitcoin
- #EBAY
- #FB
- #GOOG
- #INTC
- #KO
- #MA
- #MCD
- #MSFT
- #NTDOY
- #PEP
- #TSLA
- #TWTR
- AUDCAD
- AUDCHF
- AUDJPY
- AUDUSD
- EURCAD
- EURCHF
- EURGBP
- EURJPY
- EURNZD
- EURRUB
- EURUSD
- GBPAUD
- GBPCHF
- GBPJPY
- GBPUSD
- GOLD
- NZDCAD
- NZDCHF
- NZDJPY
- NZDUSD
- SILVER
- USDCAD
- USDCHF
- USDJPY
- USDRUB
- All
- M5
- M15
- M30
- H1
- D1
- All
- Buy
- Sale
- All
- 1
- 2
- 3
- 4
- 5
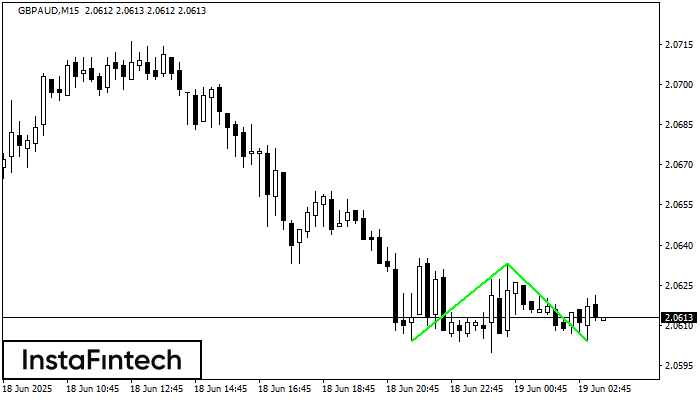
O padrão Fundo duplo foi formado em GBPAUD M15. Características: o nível de suporte 2.0604; o nível de resistência 2.0633; a largura do padrão 29 pontos. Se o nível
Os intervalos M5 e M15 podem ter mais pontos de entrada falsos.
Open chart in a new window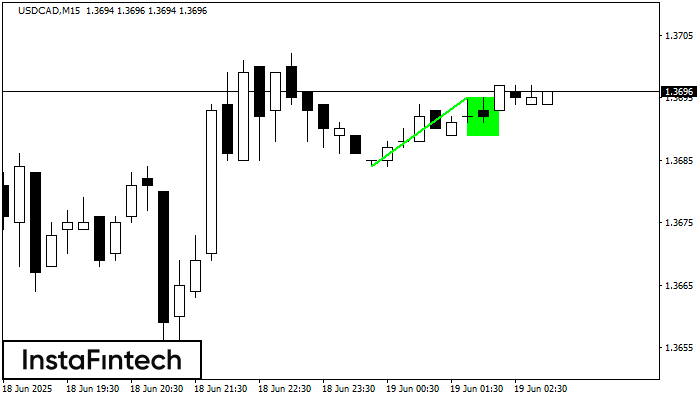
O padrão Bandeira de Alta foi formado em USDCAD a M15. O limite inferior do padrão está localizado em 1.3689/1.3689, enquanto o limite superior está em 1.3695/1.3695. A projeção
Os intervalos M5 e M15 podem ter mais pontos de entrada falsos.
Open chart in a new window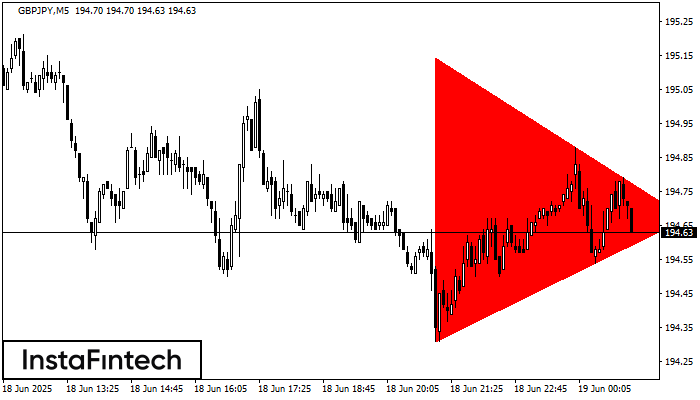
De acordo com o gráfico de M5, GBPJPY formou o padrão Triângulo Simétrico de Baixa. Descrição: o limite inferior é 194.31/194.67 e o limite superior é 195.14/194.67. A largura
Os intervalos M5 e M15 podem ter mais pontos de entrada falsos.
Open chart in a new window


