

signal strength 1 of 5
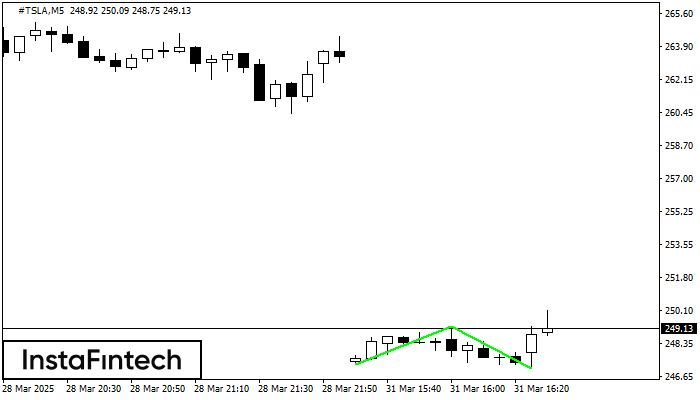
The Double Bottom pattern has been formed on #TSLA M5. This formation signals a reversal of the trend from downwards to upwards. The signal is that a buy trade should be opened after the upper boundary of the pattern 249.25 is broken. The further movements will rely on the width of the current pattern 198 points.
The M5 and M15 time frames may have more false entry points.
- All
- Double Top
- Flag
- Head and Shoulders
- Pennant
- Rectangle
- Triangle
- Triple top
- All
- #AAPL
- #AMZN
- #Bitcoin
- #EBAY
- #FB
- #GOOG
- #INTC
- #KO
- #MA
- #MCD
- #MSFT
- #NTDOY
- #PEP
- #TSLA
- #TWTR
- AUDCAD
- AUDCHF
- AUDJPY
- AUDUSD
- EURCAD
- EURCHF
- EURGBP
- EURJPY
- EURNZD
- EURRUB
- EURUSD
- GBPAUD
- GBPCHF
- GBPJPY
- GBPUSD
- GOLD
- NZDCAD
- NZDCHF
- NZDJPY
- NZDUSD
- SILVER
- USDCAD
- USDCHF
- USDJPY
- USDRUB
- All
- M5
- M15
- M30
- H1
- D1
- All
- Buy
- Sale
- All
- 1
- 2
- 3
- 4
- 5
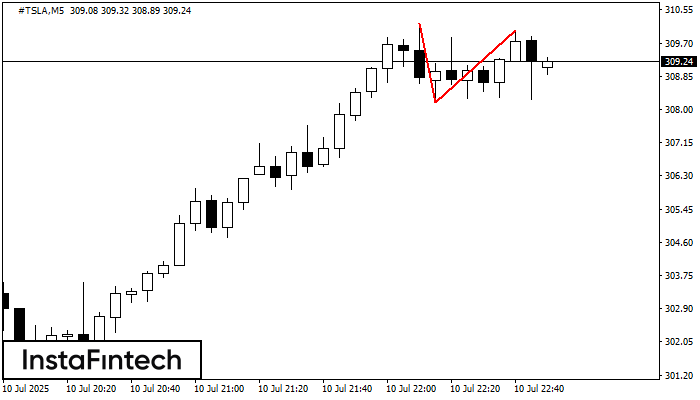
O padrão de reversão Topo duplo foi formado em #TSLA M5. Características: o limite superior 310.21; o limite inferior 308.18; a largura do padrão é de 184 pontos. As operações
Os intervalos M5 e M15 podem ter mais pontos de entrada falsos.
Open chart in a new window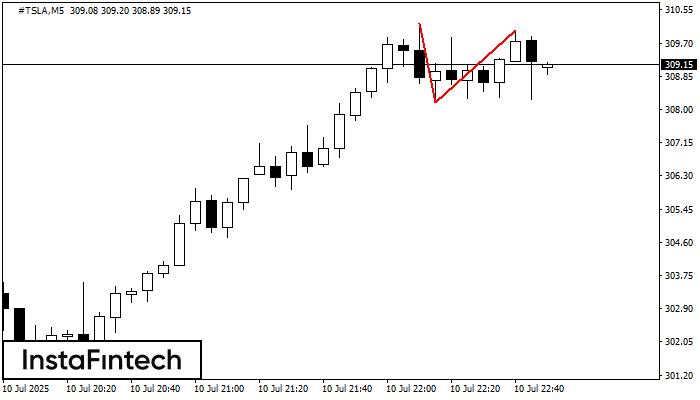
No gráfico de #TSLA M5 o padrão de reversão Topo duplo foi formado. Características: o limite superior 310.02; o limite inferior 308.18; a largura do padrão 184 pontos. O sinal
Os intervalos M5 e M15 podem ter mais pontos de entrada falsos.
Open chart in a new window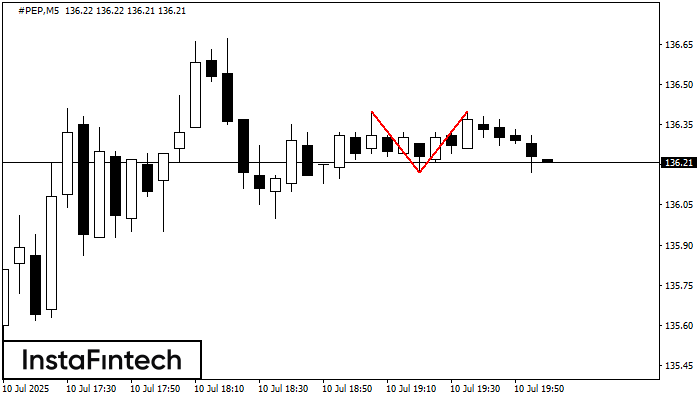
No gráfico de #PEP M5 o padrão de reversão Topo duplo foi formado. Características: o limite superior 136.40; o limite inferior 136.17; a largura do padrão 23 pontos. O sinal
Os intervalos M5 e M15 podem ter mais pontos de entrada falsos.
Open chart in a new window


