


signal strength 2 of 5

The Triple Top pattern has formed on the chart of the GOLD M15. Features of the pattern: borders have an ascending angle; the lower line of the pattern has the coordinates 3111.43/3112.94 with the upper limit 3127.49/3126.34; the projection of the width is 1606 points. The formation of the Triple Top figure most likely indicates a change in the trend from upward to downward. This means that in the event of a breakdown of the support level of 3111.43, the price is most likely to continue the downward movement.
The M5 and M15 time frames may have more false entry points.
- All
- Double Top
- Flag
- Head and Shoulders
- Pennant
- Rectangle
- Triangle
- Triple top
- All
- #AAPL
- #AMZN
- #Bitcoin
- #EBAY
- #FB
- #GOOG
- #INTC
- #KO
- #MA
- #MCD
- #MSFT
- #NTDOY
- #PEP
- #TSLA
- #TWTR
- AUDCAD
- AUDCHF
- AUDJPY
- AUDUSD
- EURCAD
- EURCHF
- EURGBP
- EURJPY
- EURNZD
- EURRUB
- EURUSD
- GBPAUD
- GBPCHF
- GBPJPY
- GBPUSD
- GOLD
- NZDCAD
- NZDCHF
- NZDJPY
- NZDUSD
- SILVER
- USDCAD
- USDCHF
- USDJPY
- USDRUB
- All
- M5
- M15
- M30
- H1
- D1
- All
- Buy
- Sale
- All
- 1
- 2
- 3
- 4
- 5
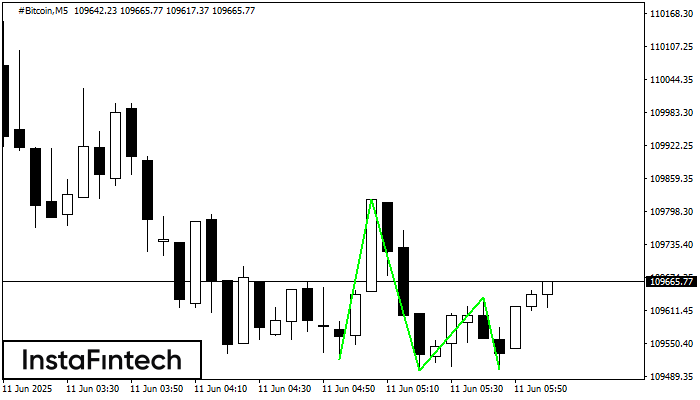
По торговому инструменту #Bitcoin на M5 была сформирована графическая фигура «Тройное дно» с характеристиками: Уровень сопротивления 109636.18; Уровень поддержки 109502.23; Ширина 13395 пунктов. В случае пробоя уровня сопротивления 109821.12 котировка
Таймфреймы М5 и М15 могут иметь больше ложных точек входа.
Открыть график инструмента в новом окне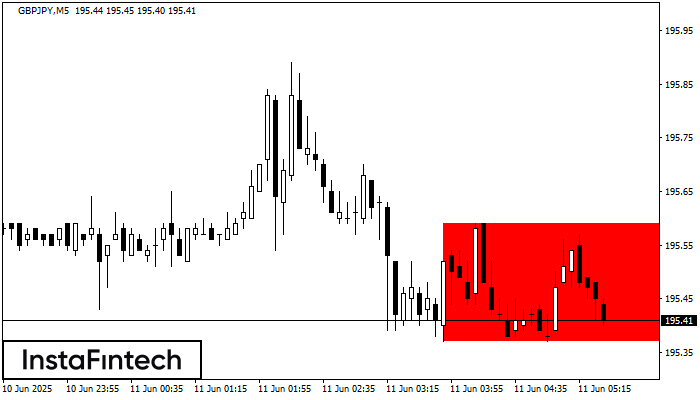
По GBPJPY M5 сформировалась фигура - «Прямоугольник». Фигура данного типа относится к тому типу продолжения тренда, который имеет два уровня: Сопротивление 195.59; Поддержка 195.37. В случае пробоя уровня поддержки 195.37
Таймфреймы М5 и М15 могут иметь больше ложных точек входа.
Открыть график инструмента в новом окне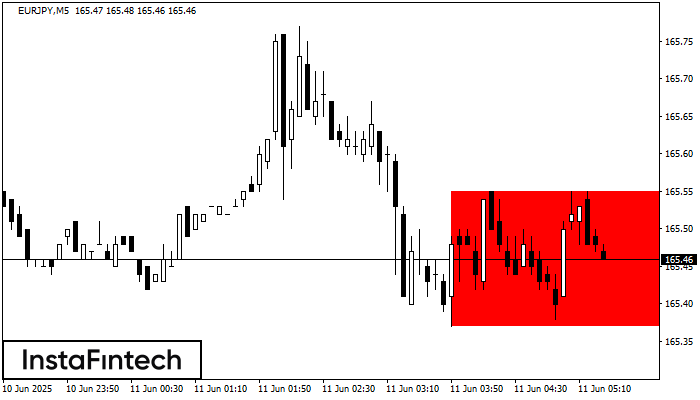
По EURJPY M5 сформировалась фигура - «Прямоугольник». Фигура данного типа относится к тому типу продолжения тренда, который имеет два уровня: Сопротивление 165.55; Поддержка 165.37. В случае пробоя уровня поддержки 165.37
Таймфреймы М5 и М15 могут иметь больше ложных точек входа.
Открыть график инструмента в новом окне


