

signal strength 1 of 5
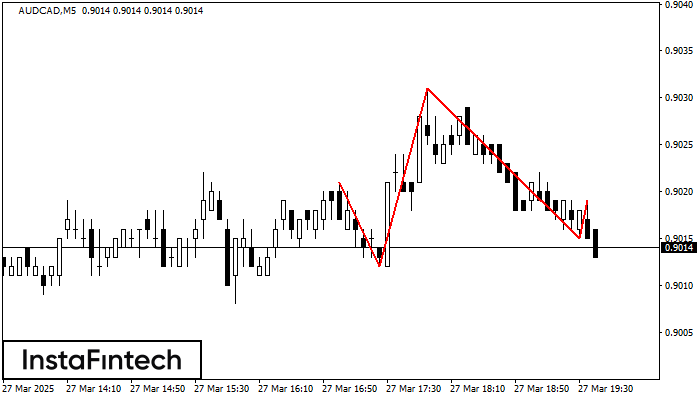
According to the chart of M5, AUDCAD formed the Head and Shoulders pattern. The Head’s top is set at 0.9031 while the median line of the Neck is found at 0.9012/0.9015. The formation of the Head and Shoulders pattern evidently signals a reversal of the upward trend. In other words, in case the scenario comes true, the price of AUDCAD will go towards 0.9000.
The M5 and M15 time frames may have more false entry points.
Veja também
- All
- Double Top
- Flag
- Head and Shoulders
- Pennant
- Rectangle
- Triangle
- Triple top
- All
- #AAPL
- #AMZN
- #Bitcoin
- #EBAY
- #FB
- #GOOG
- #INTC
- #KO
- #MA
- #MCD
- #MSFT
- #NTDOY
- #PEP
- #TSLA
- #TWTR
- AUDCAD
- AUDCHF
- AUDJPY
- AUDUSD
- EURCAD
- EURCHF
- EURGBP
- EURJPY
- EURNZD
- EURRUB
- EURUSD
- GBPAUD
- GBPCHF
- GBPJPY
- GBPUSD
- GOLD
- NZDCAD
- NZDCHF
- NZDJPY
- NZDUSD
- SILVER
- USDCAD
- USDCHF
- USDJPY
- USDRUB
- All
- M5
- M15
- M30
- H1
- D1
- All
- Buy
- Sale
- All
- 1
- 2
- 3
- 4
- 5
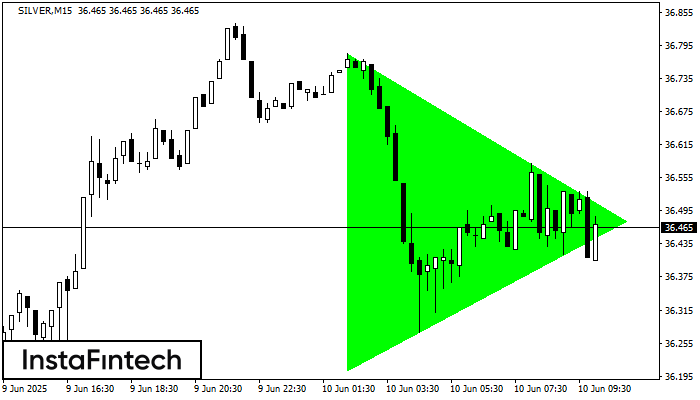
De acordo com o gráfico de M15, SILVER formou o padrão de Triângulo Simétrico de Alta, sinalizando que a tendência continuará. Descrição: O limite superior do padrão toca as coordenadas
Os intervalos M5 e M15 podem ter mais pontos de entrada falsos.
Open chart in a new window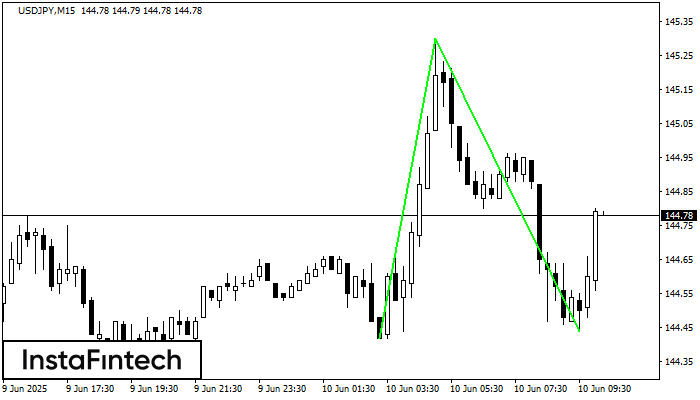
O padrão Fundo duplo foi formado em USDJPY M15. Características: o nível de suporte 144.42; o nível de resistência 145.30; a largura do padrão 88 pontos. Se o nível
Os intervalos M5 e M15 podem ter mais pontos de entrada falsos.
Open chart in a new window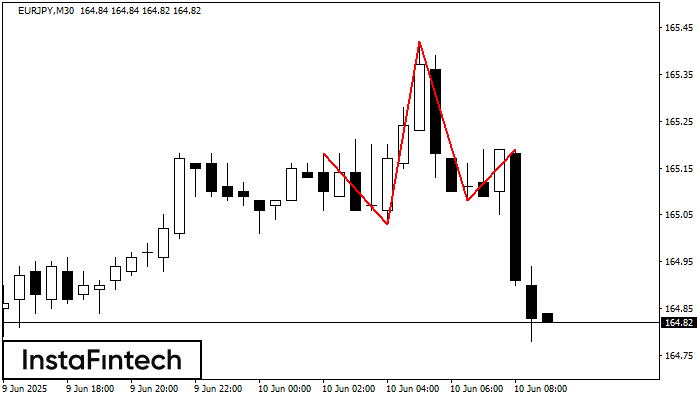
O padrão técnico chamado Cabeça & Ombros apareceu no gráfico de EURJPY M30. Há razões de peso para sugerir que o preço ultrapassará a Linha do Pescoço 165.03/165.08 após
Open chart in a new window


