

signal strength 1 of 5
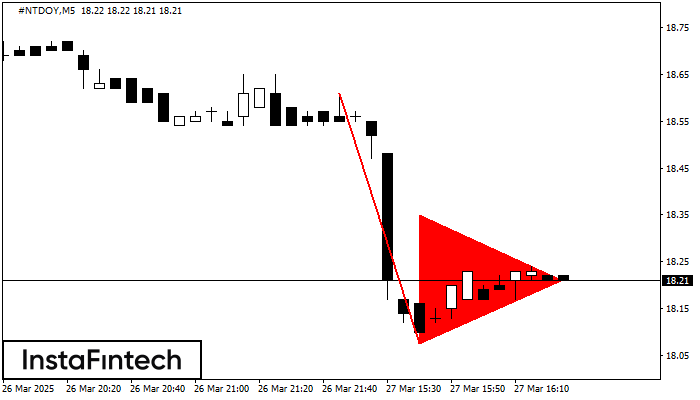
The Bearish pennant pattern has formed on the #NTDOY M5 chart. It signals potential continuation of the existing trend. Specifications: the pattern’s bottom has the coordinate of 18.08; the projection of the flagpole height is equal to 53 pips. In case the price breaks out the pattern’s bottom of 18.08, the downtrend is expected to continue for further level 17.93.
The M5 and M15 time frames may have more false entry points.
- All
- Double Top
- Flag
- Head and Shoulders
- Pennant
- Rectangle
- Triangle
- Triple top
- All
- #AAPL
- #AMZN
- #Bitcoin
- #EBAY
- #FB
- #GOOG
- #INTC
- #KO
- #MA
- #MCD
- #MSFT
- #NTDOY
- #PEP
- #TSLA
- #TWTR
- AUDCAD
- AUDCHF
- AUDJPY
- AUDUSD
- EURCAD
- EURCHF
- EURGBP
- EURJPY
- EURNZD
- EURRUB
- EURUSD
- GBPAUD
- GBPCHF
- GBPJPY
- GBPUSD
- GOLD
- NZDCAD
- NZDCHF
- NZDJPY
- NZDUSD
- SILVER
- USDCAD
- USDCHF
- USDJPY
- USDRUB
- All
- M5
- M15
- M30
- H1
- D1
- All
- Buy
- Sale
- All
- 1
- 2
- 3
- 4
- 5

O padrão Pennant de baixa foi formado no gráfico #TSLA M5. O padrão sinaliza a continuação da tendência de baixa caso o pennant de baixa de 288.55 for quebrada. Recomendações
Os intervalos M5 e M15 podem ter mais pontos de entrada falsos.
Open chart in a new window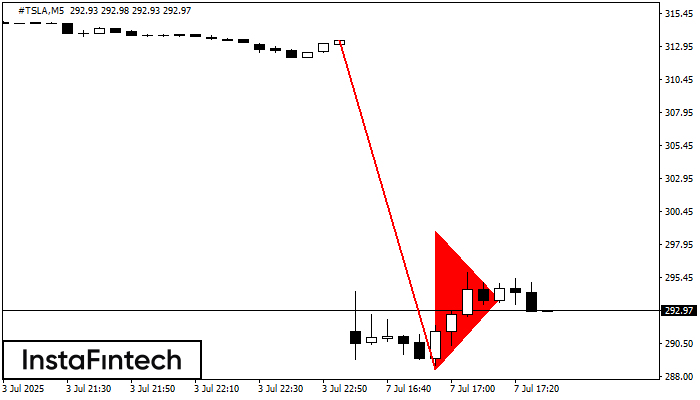
O padrão Pennant de baixa foi formado no gráfico #TSLA M5. O padrão sinaliza a continuação da tendência de baixa caso o pennant de baixa de 288.55 for quebrada. Recomendações
Os intervalos M5 e M15 podem ter mais pontos de entrada falsos.
Open chart in a new window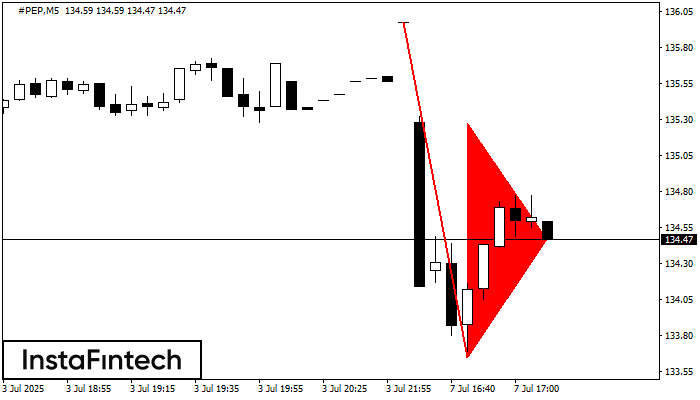
O padrão Pennant de baixa foi formado no gráfico #PEP M5. Ele sinaliza a continuação potencial da tendência existente. Especificações: o fundo do padrão tem a coordenada de 133.65;
Os intervalos M5 e M15 podem ter mais pontos de entrada falsos.
Open chart in a new window


