


signal strength 2 of 5
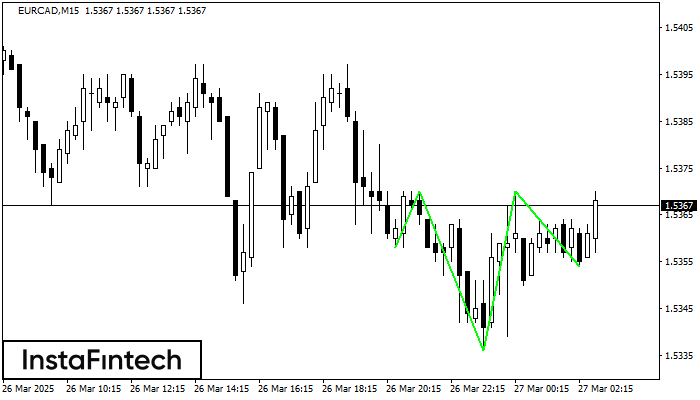
According to the chart of M15, EURCAD formed the Inverse Head and Shoulder pattern. The Head’s top is set at 1.5370 while the median line of the Neck is found at 1.5336/1.5354. The formation of the Inverse Head and Shoulder pattern evidently signals a reversal of the downward trend. In other words, in case the scenario comes true, the price of EURCAD will go towards 1.5393
The M5 and M15 time frames may have more false entry points.
Veja também
- All
- Double Top
- Flag
- Head and Shoulders
- Pennant
- Rectangle
- Triangle
- Triple top
- All
- #AAPL
- #AMZN
- #Bitcoin
- #EBAY
- #FB
- #GOOG
- #INTC
- #KO
- #MA
- #MCD
- #MSFT
- #NTDOY
- #PEP
- #TSLA
- #TWTR
- AUDCAD
- AUDCHF
- AUDJPY
- AUDUSD
- EURCAD
- EURCHF
- EURGBP
- EURJPY
- EURNZD
- EURRUB
- EURUSD
- GBPAUD
- GBPCHF
- GBPJPY
- GBPUSD
- GOLD
- NZDCAD
- NZDCHF
- NZDJPY
- NZDUSD
- SILVER
- USDCAD
- USDCHF
- USDJPY
- USDRUB
- All
- M5
- M15
- M30
- H1
- D1
- All
- Buy
- Sale
- All
- 1
- 2
- 3
- 4
- 5
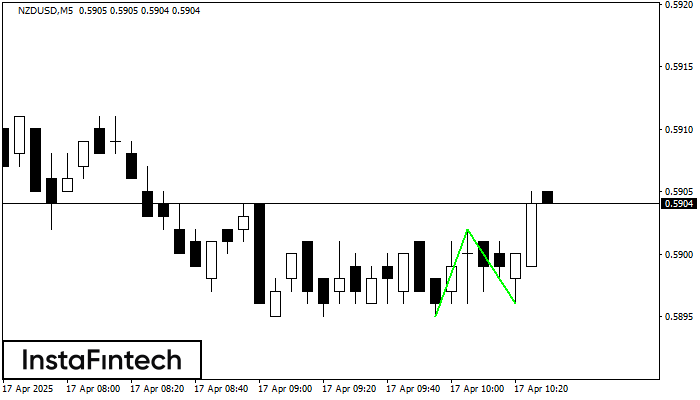
O padrão Fundo duplo foi formado em NZDUSD M5; o limite superior é 0.5902; o limite inferior é 0.5896. A largura do padrão é de 7 pontos. No caso
Os intervalos M5 e M15 podem ter mais pontos de entrada falsos.
Open chart in a new window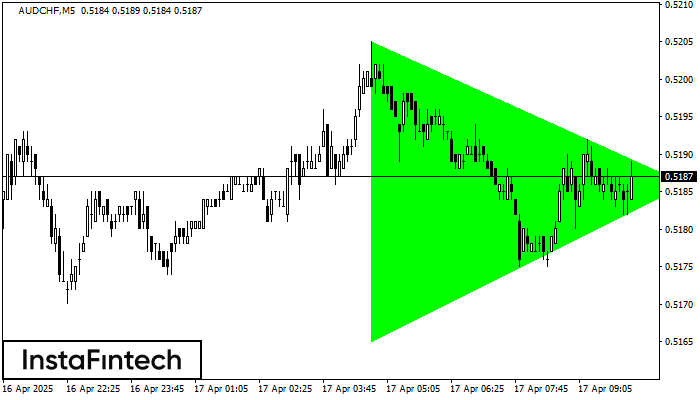
De acordo com o gráfico de M5, AUDCHF formou o padrão de Triângulo Simétrico de Alta. O limite inferior do padrão toca as coordenadas 0.5165/0.5186 enquanto o limite superior cruza
Os intervalos M5 e M15 podem ter mais pontos de entrada falsos.
Open chart in a new window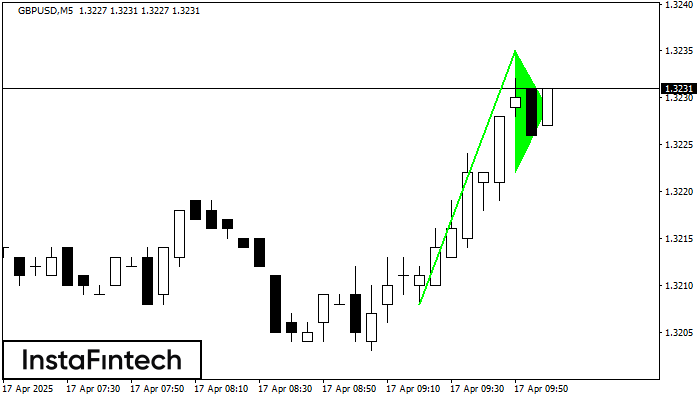
O padrão gráfico Pennant de alta foi formado no instrumento GBPUSD M5. Esse tipo de padrão se enquadra na categoria de padrões de continuação. Neste caso, se a cotação conseguir
Os intervalos M5 e M15 podem ter mais pontos de entrada falsos.
Open chart in a new window


