empty
06.11.2023 06:29 AM
BITCOIN: Technical analysis of the situation

Bitcoin

This image is no longer relevant

Higher timeframes

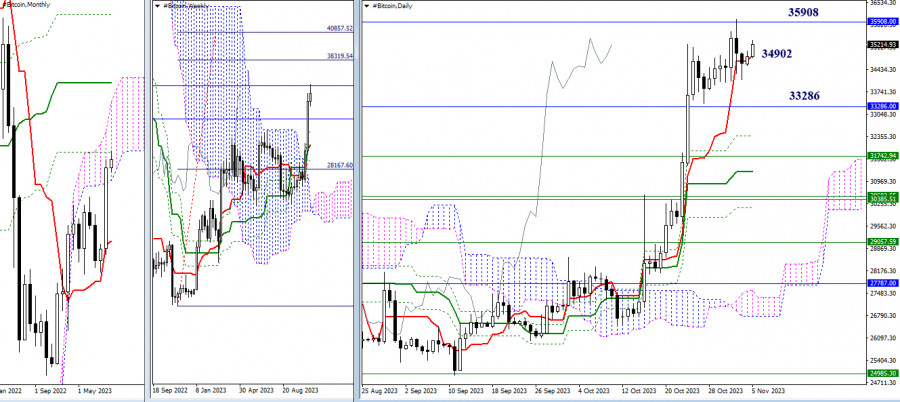
October provided bulls with moments of optimism, pushing the market away from the support of the monthly short-term trend towards the next resistance of the monthly death cross (35,908). Meanwhile, Bitcoin managed to close October within the monthly cloud (33,286), making the upper boundary of the Ichimoku cloud (40,490) the next upward target on this timeframe.

The result of October's activity was also the formation of an upward target for breaking the weekly cloud (38,320 - 40,858). These target levels (38,320 - 40,490 - 40,858) have been planned by the bullish players for November following the optimism and activity of October. This will only be possible if the bulls maintain and continue the October sentiment.

If priorities change and the bears return to the market. In that case, their focus will first be on exiting the monthly cloud (33,286) and then testing and liquidating the existing golden crosses of Ichimoku on the weekly and daily timeframes. The nearest supports from the golden crosses of Ichimoku at the moment can be noted at 32,380 - 31,743 - 31,261.

This image is no longer relevant

H4 - H1

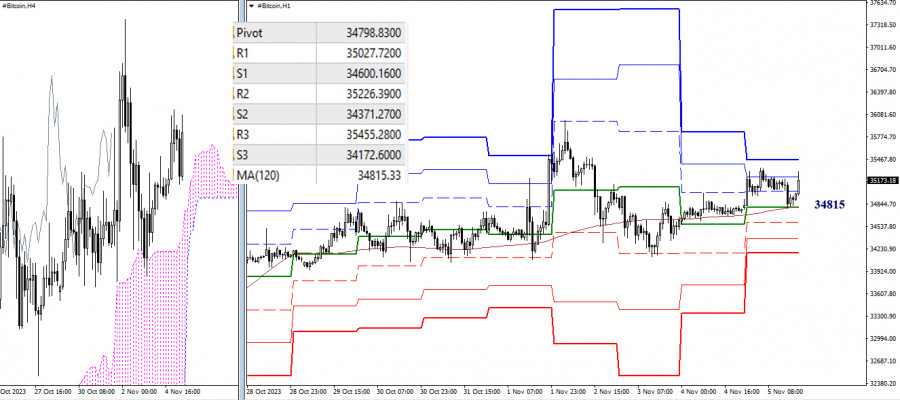
As of writing, the main advantage on the lower timeframes remains with the bullish players. However, the balance of power is very fragile because the weekly long-term trend (34,815) has been acting as support for a long time, responsible for the distribution and balance of power. Bitcoin can lose this support at any moment, after which the market's attention will shift within the day to the supports of the classic pivot points. The primary priority in this case will be the strengthening of bearish sentiments.

Note that the loss of the key level of the lower timeframes—34,815 (weekly long-term trend), is currently associated with losing the center of attraction of the daily timeframe—34,902 (short-term trend). A secure consolidation below 34,902 - 34,815 opens up new prospects for bears, both within the day and on the higher timeframes.

***

The technical analysis of the situation uses:

Higher timeframes - Ichimoku Kinko Hyo (9.26.52) + Fibo Kijun levels

H1 - Pivot Points (classic) + Moving Average 120 (weekly long-term trend)

Evangelos Poulakis,
Especialista em análise na InstaForex
© 2007-2025
Selecionar intervalo de tempo
5
min
15
min
30
min
1
hora
4
horas
1
dia
1
s.
Ganhe com as variações das taxas das criptomoedas com a InstaForex.
Baixe o MetaTrader 4 e abra a sua primeira operação.
  • Grand Choice
    Contest by
    InstaForex
    InstaForex always strives to help you
    fulfill your biggest dreams.
    PARTICIPE DO CONCURSO

Recommended Stories

Previsão para o EUR/USD em 24 de junho de 2025

Na segunda-feira, o par EUR/USD no gráfico horário apresentou duas recuperações a partir do nível de retração de Fibonacci de 76,4% em 1,1454, reverteu a favor do euro e subiu

Samir Klishi 14:25 2025-06-24 UTC+2

Previsão para o GBP/USD em 24 de junho de 2025

No gráfico horário, o par GBP/USD na segunda-feira se recuperou da zona de suporte de 1,3357–1,3373, reverteu a favor da libra esterlina e se consolidou acima da zona de 1,3425–1,3444

Samir Klishi 14:04 2025-06-24 UTC+2

Sinais de negociação para o EUR/USD para 23-28 de junho de 2025: compre acima de 1,1460 (SMA 21 - 6/8 de Murray)

Por outro lado, esta área em torno da SMA 21, localizada no nível psicológico de 1,15, é fundamental. Abaixo desta área, podemos esperar uma quebra acentuada do canal de tendência

Dimitrios Zappas 17:56 2025-06-23 UTC+2

Sinais de negociação para OURO (XAU/USD) para 23-28 de junho de 2025: compre acima de US$ 3.350 (SMA 21 - 7/8 de Murray)

Se o ouro continuar sua recuperação e se estabilizar acima da SMA 21 em 3.364, isso poderia ser visto como uma oportunidade de compra com alvos nos níveis 8/8

Dimitrios Zappas 17:54 2025-06-23 UTC+2

Previsão para o EUR/USD em 23 de junho de 2025

No gráfico semanal do euro, formou-se uma divergência de baixa, sinalizando uma possível reversão para uma tendência de queda no longo prazo. No entanto, divergências acompanhadas de intervalos (Gaps) geralmente

Laurie Bailey 16:55 2025-06-23 UTC+2

Análise técnica do movimento diário dos preços dos pares de moedas exóticas USD/IDR, segunda-feira, 23 de junho de 2025

16473.27 No gráfico diário, o par de moedas exótico USD/IDR apresenta um padrão de Alta 123, indicando um movimento de fortalecimento. Esse cenário é confirmado pelo preço operando acima

Arief Makmur 16:53 2025-06-23 UTC+2

Análise técnica do movimento intradiário dos preços do petróleo bruto, segunda-feira, 23 de junho de 2025

No gráfico de 4 horas, além da divergência entre o preço do petróleo bruto e o oscilador estocástico, formam-se um padrão 123 de baixa e um triângulo descendente, ambos reforçando

Arief Makmur 16:33 2025-06-23 UTC+2

Previsão para o GBP/USD para 23 de junho de 2025

A libra esterlina iniciou a nova semana com um gap de baixa, que ainda preserva o otimismo da alta. Permanece a possibilidade de o preço retornar acima do nível

Laurie Bailey 15:44 2025-06-23 UTC+2

Previsão para o petróleo em 23 de junho de 2025

No gráfico semanal, a linha de sinal do oscilador Marlin começou a reverter a partir do nível 9,3600. Historicamente, esse nível marcou reversões de baixa significativas — em abril

Laurie Bailey 15:28 2025-06-23 UTC+2

Previsão para o EUR/USD em 23 de junho de 2025

Na sexta-feira, o par EUR/USD continuou a subir após se recuperar do nível corretivo de 76,4% em 1,1454. No entanto, na noite de segunda-feira, o par voltou a esse nível

Samir Klishi 15:04 2025-06-23 UTC+2
Não pode falar agora?
Faça sua pergunta no chat.
Widget callback
 

Dear visitor,

Your IP address shows that you are currently located in the USA. If you are a resident of the United States, you are prohibited from using the services of InstaFintech Group including online trading, online transfers, deposit/withdrawal of funds, etc.

If you think you are seeing this message by mistake and your location is not the US, kindly proceed to the website. Otherwise, you must leave the website in order to comply with government restrictions.

Why does your IP address show your location as the USA?

  • - you are using a VPN provided by a hosting company based in the United States;
  • - your IP does not have proper WHOIS records;
  • - an error occurred in the WHOIS geolocation database.

Please confirm whether you are a US resident or not by clicking the relevant button below. If you choose the wrong option, being a US resident, you will not be able to open an account with InstaForex anyway.

We are sorry for any inconvenience caused by this message.