empty
24.03.2023 10:21 AM
EUR/USD and GBP/USD: trading plan for beginners on March 24, 2023

Macroeconomic calendar from March 23

At a monetary policy meeting yesterday, the Bank of England raised interest rates by 25 basis points to 4.25%, the highest rates since October 2008. Back then, interest rates were at 4.50%. The increase came due to persistent inflation. In February and January, consumer prices accelerated to 10.4% and 10.1% respectively. Meanwhile, economists had expected inflation to slow down in February. However, the latest press release hints at a possible end of the tightening cycle in the near term. So, it may be that we will soon see the regulator pause tightening.

Overview of technical charts from March 23

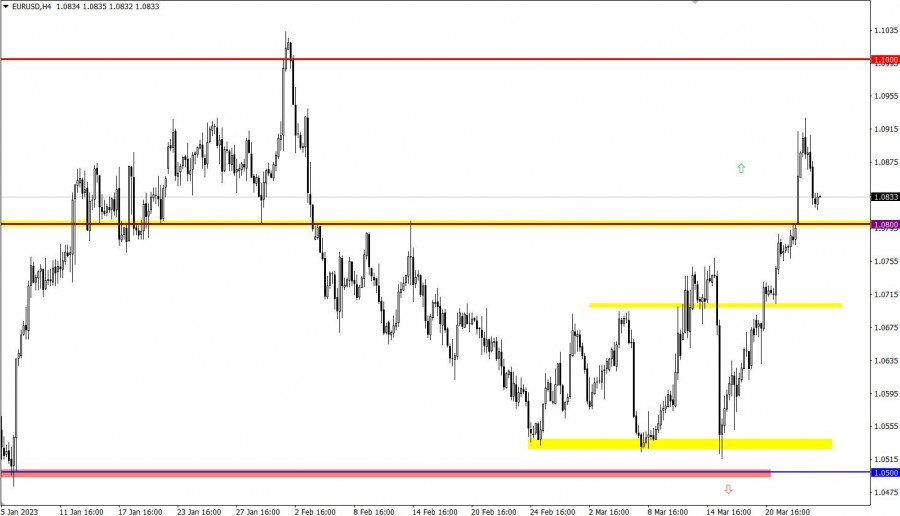
EUR/USD has gained over 250 pips since the beginning of the week. That triggered a horizontal movement with a signal to buy EUR. The volume of long positions decreased and the price retreated.

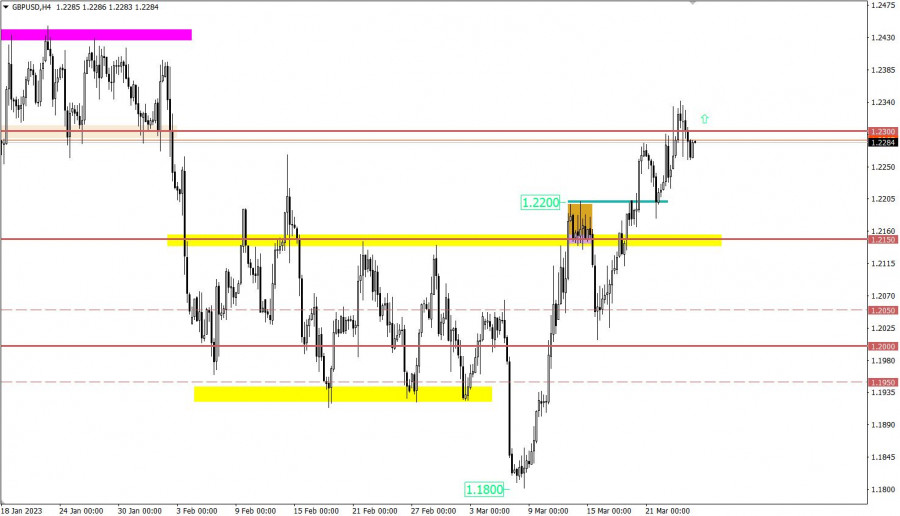
Once 1.2300 resistance was reached, GBP/USD pulled back somewhat. Nevertheless, the bull trend goes on. The pound has recouped almost all losses incurred in February.

This image is no longer relevant

Macroeconomic calendar on March 24

With the opening of European trade, UK retail sales came in, showing a rise to -3.5% versus -5.4% year-on-year. On a monthly basis, figures grew by 1.2%.

Today, a series of business activity reports will be delivered in the eurozone, the United States, and the United Kingdom. Economists expect figures to decline across the board.

Trading plan for EUR/USD on March 24

EUR/USD retreated to 1.0800 support. The price may rebound from this mark with a rise in buying volumes.

Alternatively, EUR/USD may go down if quotes stay below 1.0800 intraday.

This image is no longer relevant

Trading plan for GBP/USD on March 24

A pullback may cause a shift in sentiment. Should the price go above 1.2300, it would generate a signal to buy GBP. This could lead to a bullish continuation, and the pair could update the swing high of the medium-term trend.

Alternatively, if quotes fall below 1.2200, it will mark the rise of a downtrend.

This image is no longer relevant

What's on technical charts

The candlestick chart shows graphical white and black rectangles with upward and downward lines. While conducting a detailed analysis of each individual candlestick, it is possible to notice its features intrinsic to a particular time frame: the opening price, the closing price, and the highest and lowest price.

Horizontal levels are price levels, in relation to which a stop or reversal of the price may occur. They are called support and resistance levels.

Circles and rectangles are highlighted examples where the price reversed in the course of its history. This color highlighting indicates horizontal lines which can exert pressure on prices in the future.

Upward/downward arrows signal a possible future price direction.

Gven Podolsky,
Especialista em análise na InstaForex
© 2007-2025
Selecionar intervalo de tempo
5
min
15
min
30
min
1
hora
4
horas
1
dia
1
s.
Ganhe com as variações das taxas das criptomoedas com a InstaForex.
Baixe o MetaTrader 4 e abra a sua primeira operação.
  • Grand Choice
    Contest by
    InstaForex
    InstaForex always strives to help you
    fulfill your biggest dreams.
    PARTICIPE DO CONCURSO

Recommended Stories

GBP/USD: Plano de Negociação para a Sessão dos E.U.A de 26 de março (Revisão das Negociações da Manhã)

Na minha previsão desta manhã, destaquei o nível de 1,2926 como um ponto-chave para decisões de negociação. Agora, vamos analisar o gráfico de 5 minutos e ver o que aconteceu

Miroslaw Bawulski 19:14 2025-03-26 UTC+2

EUR/USD: Plano de Negociação para a Sessão dos E.U. de 26 de março (Revisão das Negociações da Manhã)

Na minha previsão matinal, destaquei o nível 1,0780 e planejei tomar decisões de entrada no mercado com base nele. Vamos dar uma olhada no gráfico de 5 minutos e analisar

Miroslaw Bawulski 18:57 2025-03-26 UTC+2

Recomendações de negociação e análise para o GBP/USD em 20 de março: Reunião do Banco da Inglaterra em breve

O par GBP/USD continuou sendo negociado dentro da mesma faixa na quarta-feira. Apesar da reunião do Fed, do discurso de Jerome Powell e da atualização do dot-plot, o mercado

Paolo Greco 16:47 2025-03-20 UTC+2

EUR/USD: Plano de Negociação para a Sessão dos E.U.A. de 14 de março (Revisão das Negociações da Manhã)

Na minha previsão da manhã, foquei no nível 1,0852 e planejei basear minhas decisões de negociação nele. Vamos examinar o gráfico de 5 minutos para ver o que aconteceu

Miroslaw Bawulski 21:10 2025-03-14 UTC+2

GBP/USD: Plano de Negociação para a Sessão dos E.U. de 11 de março (Análise das Negociações da Manhã). Compradores de Libra buscam uma nova máxima semanal

Na minha previsão da manhã, concentrei-me no nível 1,2876 e planejei tomar decisões de negociação com base nele. Vamos dar uma olhada no gráfico de 5 minutos e analisar

Miroslaw Bawulski 20:53 2025-03-11 UTC+2

EUR/USD: Plano de Negociação para a Sessão dos E.U. de 11 de março (Revisão das Negociações da Manhã). O euro continuou a subir e atualizou sua alta semanal

Na minha previsão da manhã, foquei no nível de 1,0886 e planejei tomar decisões de negociação com base nele. Vamos dar uma olhada no gráfico de 5 minutos e analisar

Miroslaw Bawulski 20:43 2025-03-11 UTC+2

Como negociar o GBP/USD em 7 de março? Dicas simples e análise de negociação para iniciantes

O par GBP/USD também se estabilizou na quinta-feira. Não houve razões fundamentais ou macroeconômicas que justificassem a alta ou queda da libra esterlina ou do dólar americano

Paolo Greco 16:17 2025-03-07 UTC+2

GBP/USD: Plano de Negociação para a Sessão dos E.U.A de 18 de fevereiro (Revisão das Negociações da Manhã)

Em minha previsão matinal, foquei no nível 1,2627 como um ponto-chave para as decisões de entrada no mercado. Olhando para o gráfico de 5 minutos, o par se moveu mais

Miroslaw Bawulski 16:52 2025-02-18 UTC+2

GBP/USD: Plano de negociação para a sessão dos E.U.A. de 14 de fevereiro (revisão da negociação da manhã)

Na minha previsão da manhã, foquei no nível 1,2568 e planejei tomar decisões de negociação com base nele. Vamos dar uma olhada no gráfico de 5 minutos e analisar

Miroslaw Bawulski 22:05 2025-02-14 UTC+2

GBP/USD: Plano de negociação para a sessão dos E.U.A. de 13 de fevereiro (análise das negociações da manhã)

Na minha previsão da manhã, me concentrei no nível 1,2505 e planejei tomar decisões de negociação com base nele. Vamos examinar o gráfico de 5 minutos para

Miroslaw Bawulski 21:41 2025-02-13 UTC+2
Não pode falar agora?
Faça sua pergunta no chat.
Widget callback
 

Dear visitor,

Your IP address shows that you are currently located in the USA. If you are a resident of the United States, you are prohibited from using the services of InstaFintech Group including online trading, online transfers, deposit/withdrawal of funds, etc.

If you think you are seeing this message by mistake and your location is not the US, kindly proceed to the website. Otherwise, you must leave the website in order to comply with government restrictions.

Why does your IP address show your location as the USA?

  • - you are using a VPN provided by a hosting company based in the United States;
  • - your IP does not have proper WHOIS records;
  • - an error occurred in the WHOIS geolocation database.

Please confirm whether you are a US resident or not by clicking the relevant button below. If you choose the wrong option, being a US resident, you will not be able to open an account with InstaForex anyway.

We are sorry for any inconvenience caused by this message.