

signal strength 1 of 5
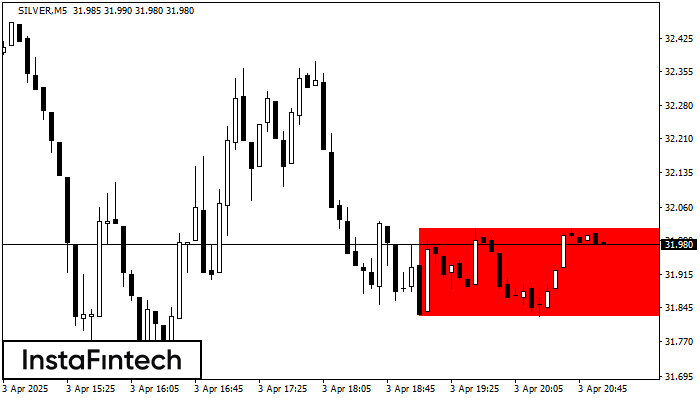
According to the chart of M5, SILVER formed the Bearish Rectangle. The pattern indicates a trend continuation. The upper border is 32.02, the lower border is 31.82. The signal means that a short position should be opened after fixing a price below the lower border 31.82 of the Bearish Rectangle.
The M5 and M15 time frames may have more false entry points.
See Also
- All
- Double Top
- Flag
- Head and Shoulders
- Pennant
- Rectangle
- Triangle
- Triple top
- All
- #AAPL
- #AMZN
- #Bitcoin
- #EBAY
- #FB
- #GOOG
- #INTC
- #KO
- #MA
- #MCD
- #MSFT
- #NTDOY
- #PEP
- #TSLA
- #TWTR
- AUDCAD
- AUDCHF
- AUDJPY
- AUDUSD
- EURCAD
- EURCHF
- EURGBP
- EURJPY
- EURNZD
- EURRUB
- EURUSD
- GBPAUD
- GBPCHF
- GBPJPY
- GBPUSD
- GOLD
- NZDCAD
- NZDCHF
- NZDJPY
- NZDUSD
- SILVER
- USDCAD
- USDCHF
- USDJPY
- USDRUB
- All
- M5
- M15
- M30
- H1
- D1
- All
- Buy
- Sale
- All
- 1
- 2
- 3
- 4
- 5
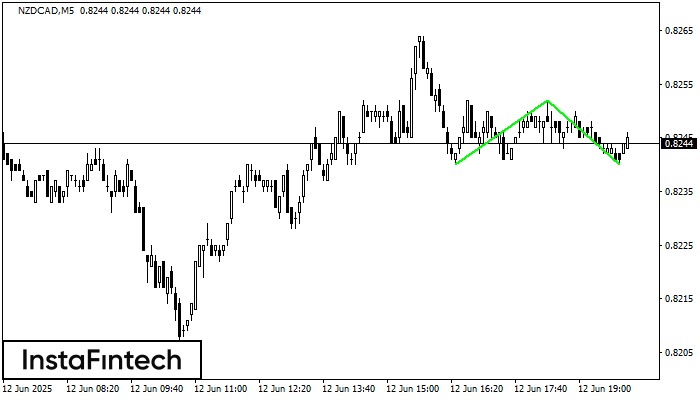
The Double Bottom pattern has been formed on NZDCAD M5; the upper boundary is 0.8252; the lower boundary is 0.8240. The width of the pattern is 12 points. In case
The M5 and M15 time frames may have more false entry points.
Open chart in a new window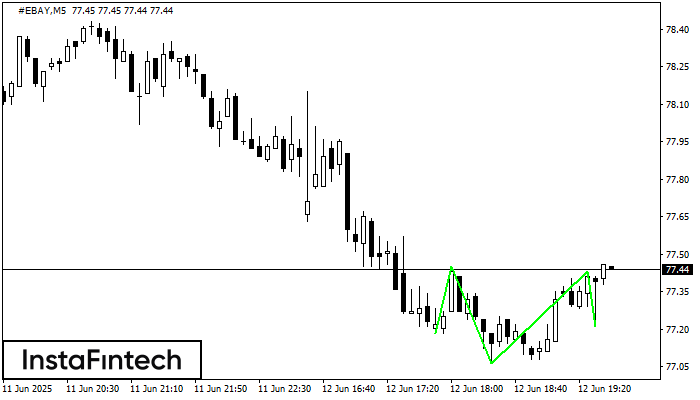
According to the chart of M5, #EBAY produced the pattern termed the Inverse Head and Shoulder. The Head is fixed at 77.06 while the median line of the Neck
The M5 and M15 time frames may have more false entry points.
Open chart in a new window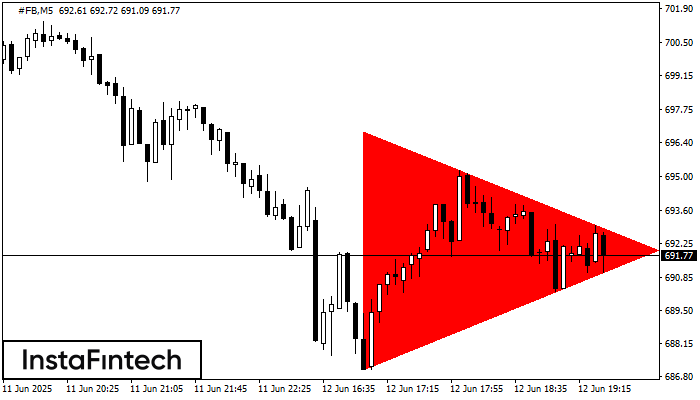
According to the chart of M5, #FB formed the Bearish Symmetrical Triangle pattern. Description: The lower border is 687.07/691.98 and upper border is 696.87/691.98. The pattern width is measured
The M5 and M15 time frames may have more false entry points.
Open chart in a new window


