

signal strength 2 of 5
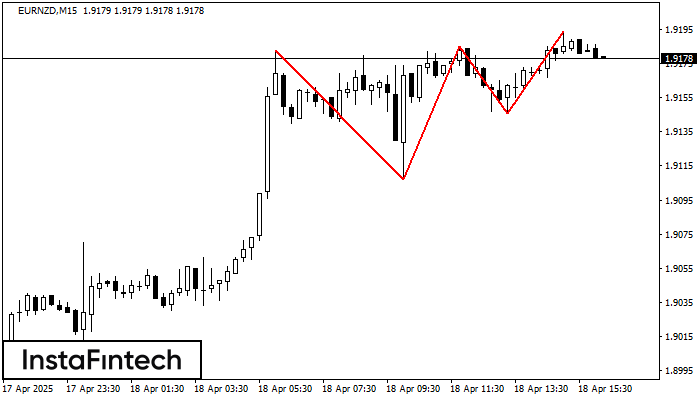
On the chart of the EURNZD M15 trading instrument, the Triple Top pattern that signals a trend change has formed. It is possible that after formation of the third peak, the price will try to break through the resistance level 1.9107, where we advise to open a trading position for sale. Take profit is the projection of the pattern’s width, which is 76 points.
The M5 and M15 time frames may have more false entry points.
یہ بھی دیکھیں
- All
- Double Top
- Flag
- Head and Shoulders
- Pennant
- Rectangle
- Triangle
- Triple top
- All
- #AAPL
- #AMZN
- #Bitcoin
- #EBAY
- #FB
- #GOOG
- #INTC
- #KO
- #MA
- #MCD
- #MSFT
- #NTDOY
- #PEP
- #TSLA
- #TWTR
- AUDCAD
- AUDCHF
- AUDJPY
- AUDUSD
- EURCAD
- EURCHF
- EURGBP
- EURJPY
- EURNZD
- EURRUB
- EURUSD
- GBPAUD
- GBPCHF
- GBPJPY
- GBPUSD
- GOLD
- NZDCAD
- NZDCHF
- NZDJPY
- NZDUSD
- SILVER
- USDCAD
- USDCHF
- USDJPY
- USDRUB
- All
- M5
- M15
- M30
- H1
- D1
- All
- Buy
- Sale
- All
- 1
- 2
- 3
- 4
- 5
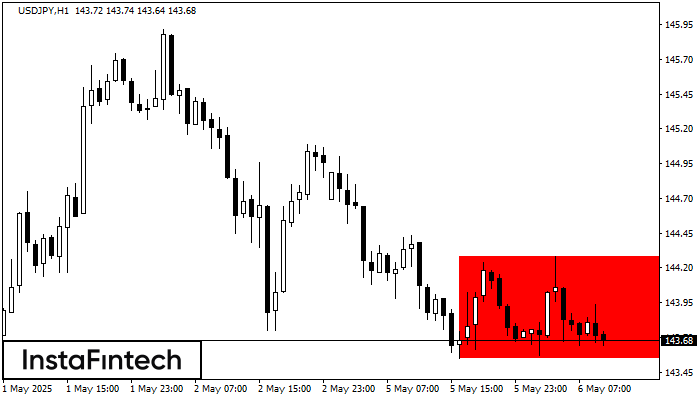
According to the chart of H1, USDJPY formed the Bearish Rectangle which is a pattern of a trend continuation. The pattern is contained within the following borders: lower border 143.55
Open chart in a new window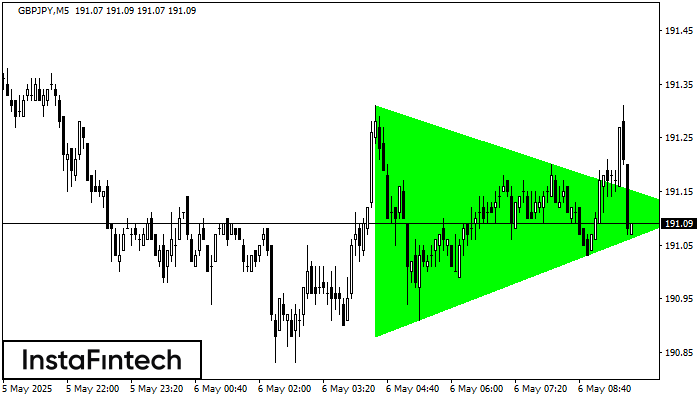
According to the chart of M5, GBPJPY formed the Bullish Symmetrical Triangle pattern. The lower border of the pattern touches the coordinates 190.88/191.11 whereas the upper border goes across 191.31/191.11
The M5 and M15 time frames may have more false entry points.
Open chart in a new window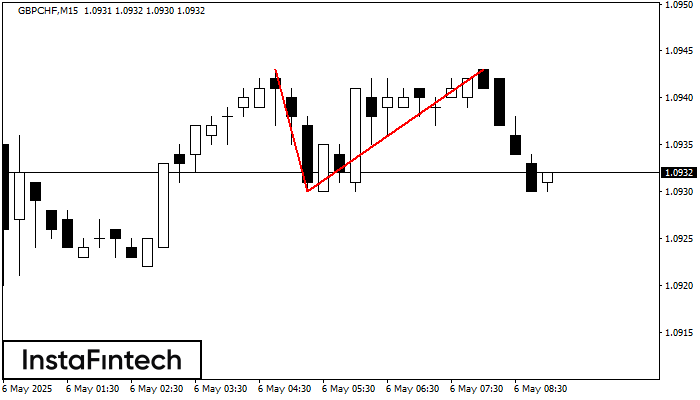
On the chart of GBPCHF M15 the Double Top reversal pattern has been formed. Characteristics: the upper boundary 1.0943; the lower boundary 1.0930; the width of the pattern 13 points
The M5 and M15 time frames may have more false entry points.
Open chart in a new window


