


signal strength 2 of 5
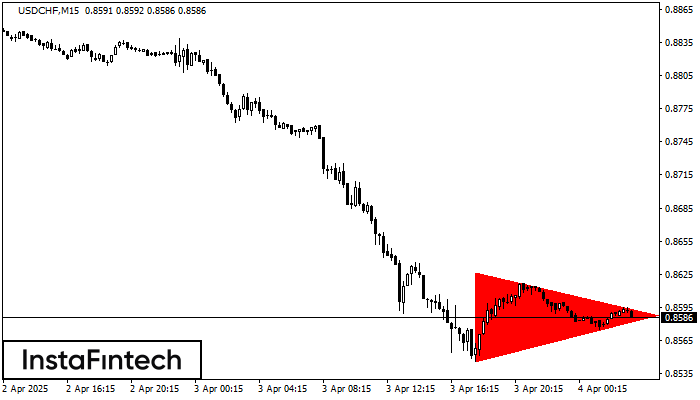
According to the chart of M15, USDCHF formed the Bearish Symmetrical Triangle pattern. This pattern signals a further downward trend in case the lower border 0.8546 is breached. Here, a hypothetical profit will equal the width of the available pattern that is -80 pips.
The M5 and M15 time frames may have more false entry points.
یہ بھی دیکھیں
- All
- Double Top
- Flag
- Head and Shoulders
- Pennant
- Rectangle
- Triangle
- Triple top
- All
- #AAPL
- #AMZN
- #Bitcoin
- #EBAY
- #FB
- #GOOG
- #INTC
- #KO
- #MA
- #MCD
- #MSFT
- #NTDOY
- #PEP
- #TSLA
- #TWTR
- AUDCAD
- AUDCHF
- AUDJPY
- AUDUSD
- EURCAD
- EURCHF
- EURGBP
- EURJPY
- EURNZD
- EURRUB
- EURUSD
- GBPAUD
- GBPCHF
- GBPJPY
- GBPUSD
- GOLD
- NZDCAD
- NZDCHF
- NZDJPY
- NZDUSD
- SILVER
- USDCAD
- USDCHF
- USDJPY
- USDRUB
- All
- M5
- M15
- M30
- H1
- D1
- All
- Buy
- Sale
- All
- 1
- 2
- 3
- 4
- 5
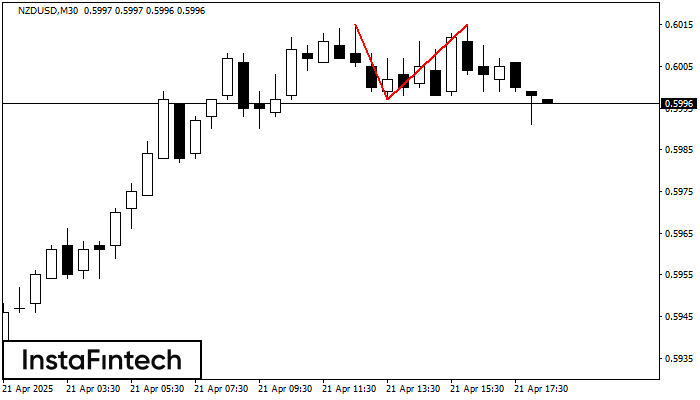
The Double Top pattern has been formed on NZDUSD M30. It signals that the trend has been changed from upwards to downwards. Probably, if the base of the pattern 0.5997
Open chart in a new window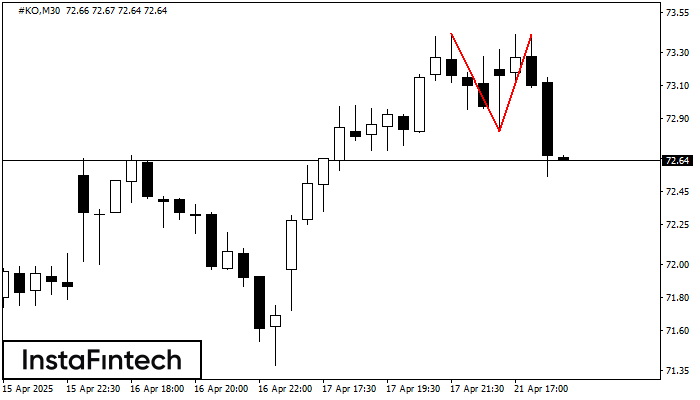
The Double Top reversal pattern has been formed on #KO M30. Characteristics: the upper boundary 73.42; the lower boundary 72.82; the width of the pattern is 59 points. Sell trades
Open chart in a new window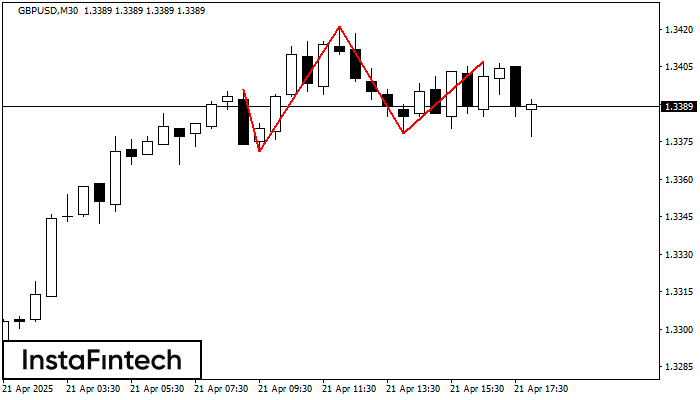
According to the chart of M30, GBPUSD formed the Head and Shoulders pattern. The Head’s top is set at 1.3421 while the median line of the Neck is found
Open chart in a new window


