


signal strength 2 of 5

The Triple Top pattern has formed on the chart of the GOLD M15 trading instrument. It is a reversal pattern featuring the following characteristics: resistance level 76, support level -995, and pattern’s width 1554. Forecast If the price breaks through the support level 3111.14, it is likely to move further down to 3124.98.
The M5 and M15 time frames may have more false entry points.
- All
- Double Top
- Flag
- Head and Shoulders
- Pennant
- Rectangle
- Triangle
- Triple top
- All
- #AAPL
- #AMZN
- #Bitcoin
- #EBAY
- #FB
- #GOOG
- #INTC
- #KO
- #MA
- #MCD
- #MSFT
- #NTDOY
- #PEP
- #TSLA
- #TWTR
- AUDCAD
- AUDCHF
- AUDJPY
- AUDUSD
- EURCAD
- EURCHF
- EURGBP
- EURJPY
- EURNZD
- EURRUB
- EURUSD
- GBPAUD
- GBPCHF
- GBPJPY
- GBPUSD
- GOLD
- NZDCAD
- NZDCHF
- NZDJPY
- NZDUSD
- SILVER
- USDCAD
- USDCHF
- USDJPY
- USDRUB
- All
- M5
- M15
- M30
- H1
- D1
- All
- Buy
- Sale
- All
- 1
- 2
- 3
- 4
- 5

According to the chart of M30, NZDJPY formed the Bearish Symmetrical Triangle pattern. Description: The lower border is 83.98/84.43 and upper border is 84.90/84.43. The pattern width is measured
Open chart in a new window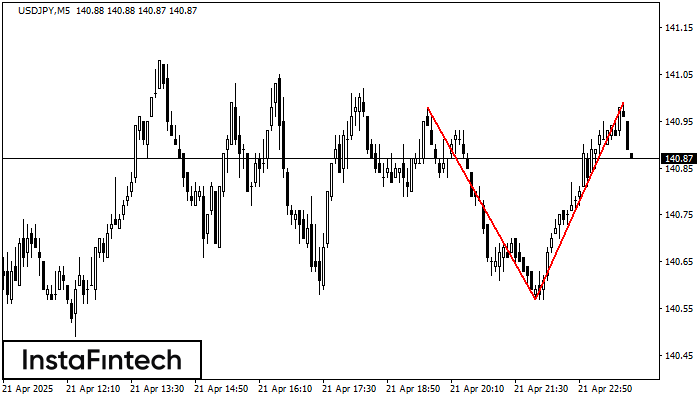
The Double Top reversal pattern has been formed on USDJPY M5. Characteristics: the upper boundary 140.98; the lower boundary 140.57; the width of the pattern is 42 points. Sell trades
The M5 and M15 time frames may have more false entry points.
Open chart in a new window
According to the chart of M5, #Bitcoin formed the Bullish Symmetrical Triangle pattern, which signals the trend will continue. Description. The upper border of the pattern touches the coordinates 88419.31/87233.62
The M5 and M15 time frames may have more false entry points.
Open chart in a new window


