


signal strength 2 of 5

The Bearish pennant pattern has formed on the #AAPL M15 chart. It signals potential continuation of the existing trend. Specifications: the pattern’s bottom has the coordinate of 216.06; the projection of the flagpole height is equal to 323 pips. In case the price breaks out the pattern’s bottom of 216.06, the downtrend is expected to continue for further level 215.84.
The M5 and M15 time frames may have more false entry points.
یہ بھی دیکھیں
- All
- Double Top
- Flag
- Head and Shoulders
- Pennant
- Rectangle
- Triangle
- Triple top
- All
- #AAPL
- #AMZN
- #Bitcoin
- #EBAY
- #FB
- #GOOG
- #INTC
- #KO
- #MA
- #MCD
- #MSFT
- #NTDOY
- #PEP
- #TSLA
- #TWTR
- AUDCAD
- AUDCHF
- AUDJPY
- AUDUSD
- EURCAD
- EURCHF
- EURGBP
- EURJPY
- EURNZD
- EURRUB
- EURUSD
- GBPAUD
- GBPCHF
- GBPJPY
- GBPUSD
- GOLD
- NZDCAD
- NZDCHF
- NZDJPY
- NZDUSD
- SILVER
- USDCAD
- USDCHF
- USDJPY
- USDRUB
- All
- M5
- M15
- M30
- H1
- D1
- All
- Buy
- Sale
- All
- 1
- 2
- 3
- 4
- 5
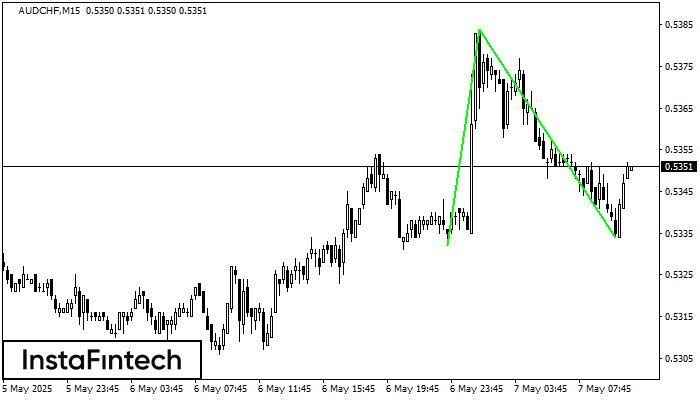
The Double Bottom pattern has been formed on AUDCHF M15; the upper boundary is 0.5384; the lower boundary is 0.5334. The width of the pattern is 52 points. In case
The M5 and M15 time frames may have more false entry points.
Open chart in a new window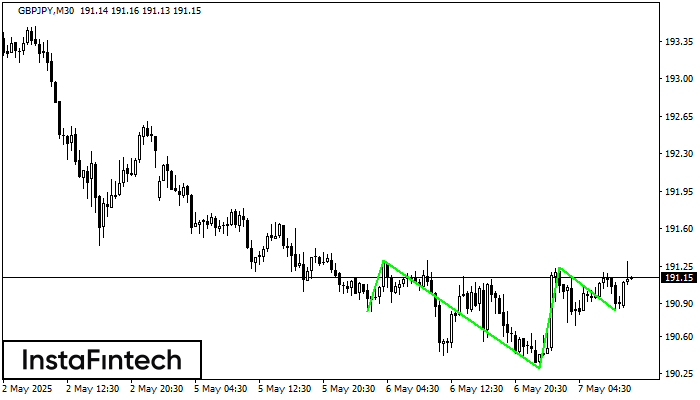
According to the chart of M30, GBPJPY produced the pattern termed the Inverse Head and Shoulder. The Head is fixed at 190.30 while the median line of the Neck
Open chart in a new window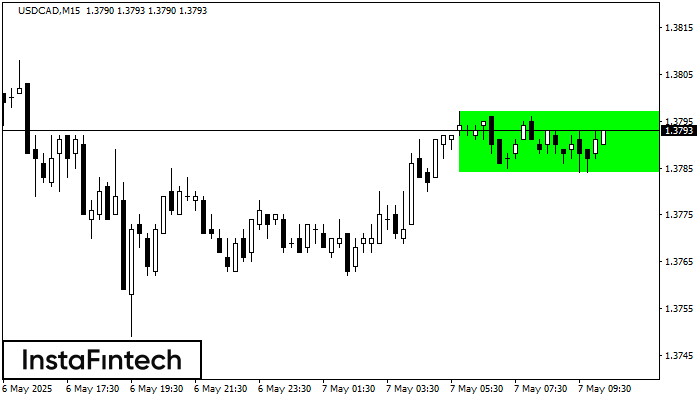
According to the chart of M15, USDCAD formed the Bullish Rectangle. This type of a pattern indicates a trend continuation. It consists of two levels: resistance 1.3797 and support 1.3784
The M5 and M15 time frames may have more false entry points.
Open chart in a new window


