empty
22.01.2024 12:16 PM
Trading Plan for Beginner Traders of EUR/USD and GBP/USD for January 22, 2024

Details of the Economic Calendar on January 19

Retail sales in the United Kingdom in December fell by 3.2% month-on-month, marking the largest decline in three years. This figure is the lowest since January 2021, when retail stores suffered due to the coronavirus pandemic. Year-on-year, retail sales in the country decreased by 2.4%, exceeding forecasts and the expected reduction of 1.1%.

Analysis of Trading Charts from January 19

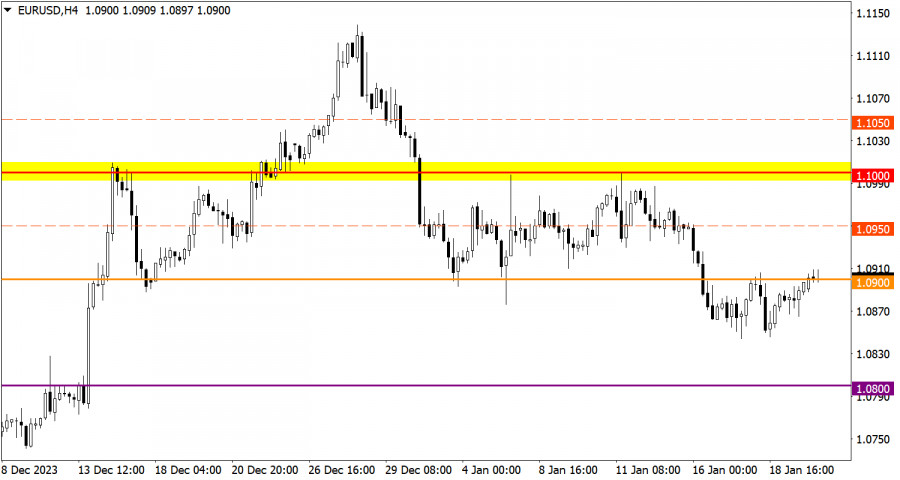
The EUR/USD currency pair returned to the 1.0900 level during its pullback, where it has experienced fluctuating movement for the second consecutive trading day.

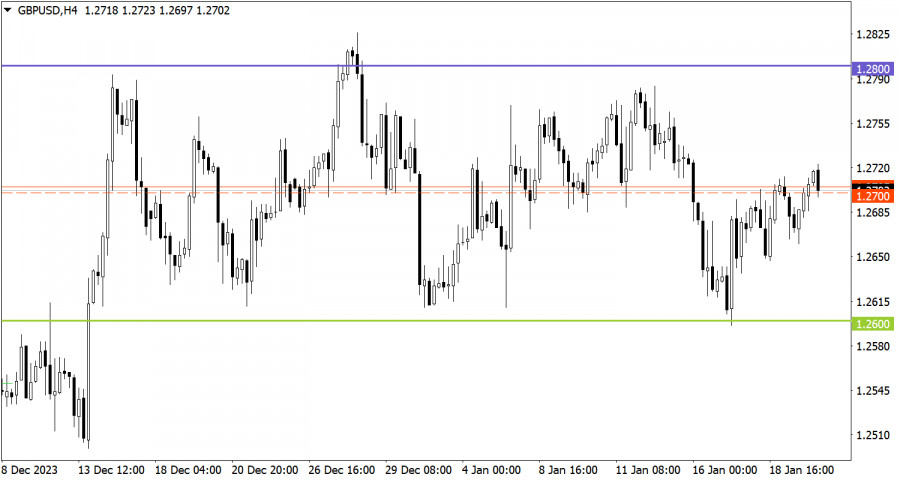
GBP/USD continues to move within a five-week sideways channel of 1.2600/1.2800, consistently testing the established boundaries. Currently, the price has stabilized above the average level of 1.2700, indicating an increase in the volume of long positions within the sideways trend.

This image is no longer relevant

Economic Calendar for January 22

No significant economic events are expected on Monday, and the macroeconomic calendar remains relatively empty. However, it is important to pay attention to the speech of European Central Bank President Christine Lagarde.

Statements by central bank representatives, especially their remarks regarding economic policy and forecasts, can influence financial markets. Therefore, investors and traders follow the comments and statements of key figures in the global economy to understand potential changes in long-term or short-term outlooks.

EUR/USD Trading Plan for January 22

The current situation suggests that stabilization of the price above the 1.0900 level during the trading day may stimulate an increase in long positions, leading to the currency rate moving towards the 1.1000 level. On the other hand, a return of the price below 1.0850 could activate a downward scenario.

This image is no longer relevant

GBP/USD Trading Plan for January 22

In this situation, market participants continue to focus on trading within the boundaries of the sideways channel, which apparently limits the price movement for the GBP/USD currency pair. Technical analysis indicates the possibility of the currency rate moving towards the upper boundary of the channel, located at the 1.2800 level.

However, it is important to remember that a flat is a temporary price manifestation, leading to the accumulation of trading forces and significant attention from speculators. This will eventually result in impulsive jumps that will lead to its conclusion and indicate subsequent market movement. For this reason, it is always worth considering a breakout trading tactic.

This image is no longer relevant

What's on the charts

The candlestick chart type is white and black graphic rectangles with lines above and below. With a detailed analysis of each individual candle, you can see its characteristics relative to a particular time frame: opening price, closing price, intraday high and low.

Horizontal levels are price coordinates, relative to which a price may stop or reverse its trajectory. In the market, these levels are called support and resistance.

Circles and rectangles are highlighted examples where the price reversed in history. This color highlighting indicates horizontal lines that may put pressure on the asset's price in the future.

The up/down arrows are landmarks of the possible price direction in the future.

Gven Podolsky,
انسٹافاریکس کا تجزیاتی ماہر
© 2007-2025
ٹائم فریم منتخب کریں
5
منٹ
15
منٹ
30
منٹ
1
گھنٹہ
4
گھنٹے
1
دن
1
ہفتہ
انسٹافاریکس کے ساتھ کرپٹو کرنسی کی معاملاتی تبدیلیوں سے کمائیں۔
میٹا ٹریڈر 4 ڈاؤن لوڈ کریں اور اپنی پہلی ٹریڈ کھولیں۔
  • Grand Choice
    Contest by
    InstaForex
    InstaForex always strives to help you
    fulfill your biggest dreams.
    مقابلہ میں شامل ہوں

تجویز کردہ مضامین

4 اپریل کو برطانوی پاؤنڈ/امریکی ڈالر کے پیئر کی تجارت کیسے کی جائے؟ نئے تاجروں کے لیے آسان تجاویز اور تجارتی تجزیہ

جمعرات کی تجارت کا تجزیہ برطانوی پاؤنڈ/امریکی ڈالر کا 1 گھنٹے چارٹ جمعرات کو برطانوی پاؤنڈ/امریکی ڈالر جوڑی نے بھی اوپر کی طرف ایک مضبوط حرکت دکھائی۔ EUR سے متعلقہ

Paolo Greco 13:56 2025-04-04 UTC+2

4 اپریل کو یورو/امریکی ڈالر کے جوڑے کی تجارت کیسے کی جائے؟ نئے تاجروں کے لیے آسان تجاویز اور تجارتی تجزیہ

جمعرات کی تجارت کا تجزیہ یورو/امریکی ڈالر کا 1 گھنٹے چارٹ یورو/امریکی ڈالر کرنسی کے جوڑے نے جمعرات کو ایک مضبوط اوپر کی حرکت پوسٹ کی۔ اس صورتحال

Paolo Greco 13:52 2025-04-04 UTC+2

4 پر برطانوی پاؤنڈ/امریکی ڈالر کے لیے تجارتی سفارشات اور تجزیہ: کیا پاول صورتحال کو ٹھیک کر سکتا ہے؟

برطانوی پاؤنڈ/امریکی ڈالر کا 5 منٹ کا تجزیہ جمعرات کو برطانوی پاؤنڈ/امریکی ڈالر کی کرنسی کے جوڑے نے بھی اوپر کی طرف ایک مضبوط حرکت دکھائی۔ قدرتی طور پر،

Paolo Greco 13:46 2025-04-04 UTC+2

4 اپریل کو یورو/امریکی ڈالر کے لیے تجارتی سفارشات اور تجزیہ: مارکیٹ میں نیا خوف

یورو/امریکی ڈالر کا 5 منٹ کا تجزیہ یورو/امریکی ڈالر کرنسی کے جوڑے نے جمعرات کو مضبوط اوپر کی حرکت دکھائی۔ سچ کہوں تو ہم پچھلے دو مہینوں

Paolo Greco 13:38 2025-04-04 UTC+2

3 اپریل کو یورو/امریکی ڈالر کے جوڑے کی تجارت کیسے کی جائے؟ نئے تاجروں کے لیے آسان تجاویز اور تجارتی تجزیہ

بدھ کی تجارت کا تجزیہ یورو/امریکی ڈالر کا 1 گھنٹے چارٹ یورو/امریکی ڈالر کرنسی کے جوڑے نے بدھ کو فائدہ کے ساتھ تجارت کی، حالانکہ اس کا میکرو اکنامک

Paolo Greco 13:44 2025-04-03 UTC+2

3 اپریل کو برطانوی پاؤنڈ/امریکی ڈالر کے لیے تجارتی سفارشات اور تجزیہ: برطانوی پاؤنڈ فلیٹ رینج میں رہتا ہے

برطانوی پاؤنڈ/امریکی ڈالر کا 5 منٹ کا تجزیہ برطانوی پاؤنڈ/امریکی ڈالر کرنسی جوڑی نے بدھ کے روز سائیڈ وے چینل کے اندر تجارت جاری رکھی۔ گزشتہ دو ہفتوں کے دوران،

Paolo Greco 13:32 2025-04-03 UTC+2

3 اپریل کو یورو/امریکی ڈالر کے لیے تجارتی سفارشات اور تجزیہ: کوئی ٹیرف، کوئی حرکت نہیں

یورو/امریکی ڈالر کا 5 منٹ کا تجزیہ یورو/امریکی ڈالر کرنسی کے جوڑے نے بدھ کو تجارت کی جیسا کہ اس نے پیر اور منگل کو کیا تھا۔ دن کے بیشتر

Paolo Greco 13:25 2025-04-03 UTC+2

2 اپریل کو برطانوی پاؤنڈ/امریکی ڈالر کے پیئر کی تجارت کیسے کی جائے؟ نئے تاجروں کے لیے آسان تجاویز اور تجارتی تجزیہ

منگل کی تجارت کا تجزیہ برطانوی پاؤنڈ/امریکی ڈالر کا 1 گھنٹے چارٹ منگل کو، برطانوی پاؤنڈ/امریکی ڈالر جوڑی نے ایک فلیٹ رینج کے اندر تجارت جاری رکھی، جیسا

Paolo Greco 13:28 2025-04-02 UTC+2

2 اپریل کو یورو/امریکی ڈالر کے جوڑے کی تجارت کیسے کی جائے؟ نئے تاجروں کے لیے آسان تجاویز اور تجارتی تجزیہ

منگل کی تجارت کا تجزیہ یورو/امریکی ڈالر کا 1 گھنٹے چارٹ منگل کو، یورو/امریکی ڈالر کرنسی جوڑے نے پچھلے ہفتوں کی طرح اسی موڈ میں تجارت جاری رکھی۔

Paolo Greco 13:25 2025-04-02 UTC+2

2 اپریل کو یورو/امریکی ڈالر کے لیے تجارتی سفارشات اور تجزیہ: پیر خاموشی سے منگل میں پھسل گیا

یورو/امریکی ڈالر کا 5 منٹ کا تجزیہ یورو/امریکی ڈالر کرنسی کے جوڑے نے منگل کو اسی طرح تجارت کی جس طرح پیر کو تھی۔ کل، ہم نے خبردار

Paolo Greco 13:13 2025-04-02 UTC+2
ابھی فوری بات نہیں کرسکتے ؟
اپنا سوال پوچھیں بذریعہ چیٹ.
Widget callback
 

Dear visitor,

Your IP address shows that you are currently located in the USA. If you are a resident of the United States, you are prohibited from using the services of InstaFintech Group including online trading, online transfers, deposit/withdrawal of funds, etc.

If you think you are seeing this message by mistake and your location is not the US, kindly proceed to the website. Otherwise, you must leave the website in order to comply with government restrictions.

Why does your IP address show your location as the USA?

  • - you are using a VPN provided by a hosting company based in the United States;
  • - your IP does not have proper WHOIS records;
  • - an error occurred in the WHOIS geolocation database.

Please confirm whether you are a US resident or not by clicking the relevant button below. If you choose the wrong option, being a US resident, you will not be able to open an account with InstaForex anyway.

We are sorry for any inconvenience caused by this message.