empty
16.11.2023 11:20 AM
EUR/USD and GBP/USD: Trading plan for beginner traders on November 16, 2023

Details of the Economic Calendar on November 15

Inflation data for the United Kingdom was released. The Consumer Price Index fell to 4.6%, while the expected level was 4.9%. Based on the new data, it is highly likely that the Bank of England will not raise the interest rate.

A bit later, industrial production data in the EU was released, showing an accelerated decline from -5.1% to -6.9%, worse than the forecast of -6.2%. This is a negative factor for the EU economy, which is already facing serious difficulties.

During the U.S. trading session, retail sales data in the United States were released. The growth rate slowed from 4.1% to 2.5%, while a slowdown from 3.8% to 2.1% was expected. These data not only exceeded the forecast, but also the previous indicators were revised upwards. The U.S. dollar received support from buyers based on positive statistical data.

This image is no longer relevant

Analysis of Trading Charts from November 15

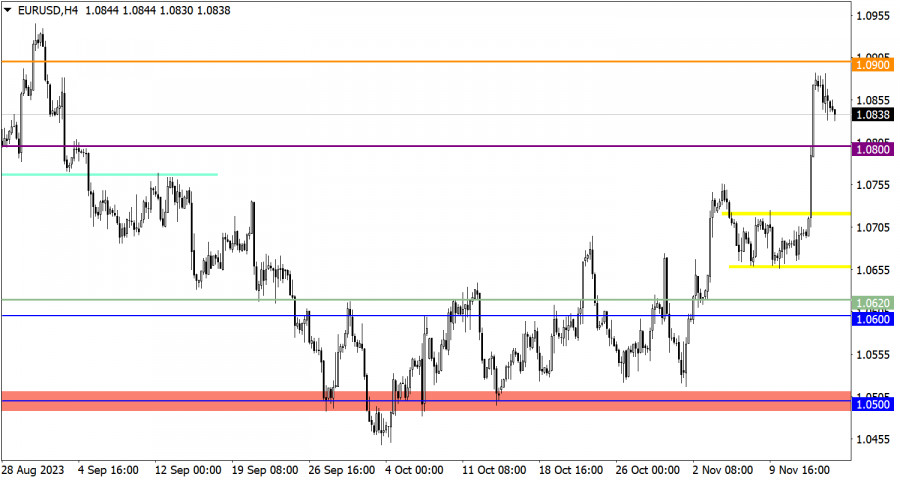
The EUR/USD currency pair entered a pullback stage amid high level of overbought conditions. The level of 1.0900 serves as resistance, near which there was a reduction in the volume of long positions.

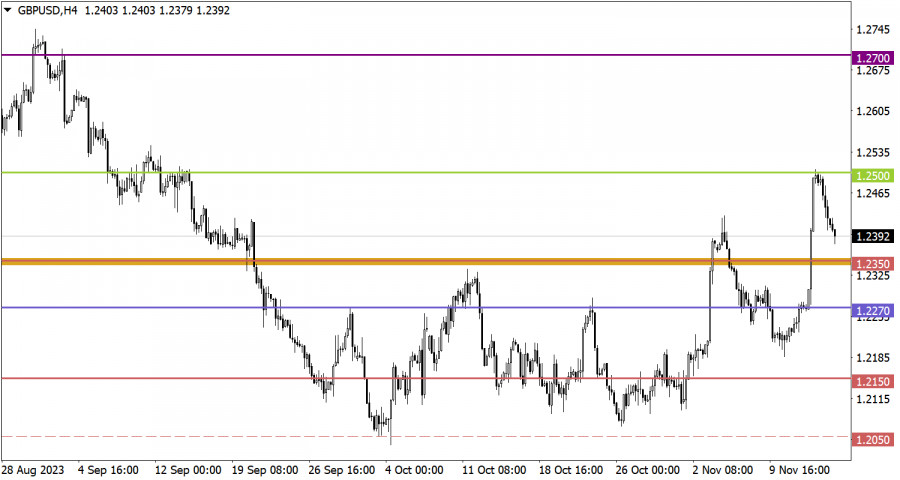
The GBP/USD currency pair shows a similar technical picture. First, there was a signal of overbought conditions for the pound, then the resistance level at 1.2500 was reached. Near this level, there is a decline in the volume of long positions, leading to a price pullback.

Economic Calendar on November 16

Today, data on unemployment benefit claims in the United States is expected to be published, where an overall increase in their indicator is predicted. Statistical data details indicate that the volume of continuing claims for benefits may rise from 1.834 million to 1.847 million, and the volume of initial claims for benefits may rise from 217,000 to 220,000.

Time Targeting

United States Jobless Claims – 13:30 UTC

EUR/USD Trading Plan for November 16

The ongoing pullback is still present in the market, which is why traders are considering a scenario of movement towards the level of 1.0800. The further course of events will depend on the price behavior near this level: whether sellers can keep the quote below it, or the level will be used as support.

This image is no longer relevant

GBP/USD Trading Plan for November 16

At the moment, the pullback has already exceeded +100 points from the level of 1.2500. In case of maintaining a downward trend during the pullback, further decline to the support level of 1.2350 is possible. Further movement will also be influenced by the price near the control level of 1.2350.

This image is no longer relevant

What's on the charts

The candlestick chart type is white and black graphic rectangles with lines above and below. With a detailed analysis of each individual candle, you can see its characteristics relative to a particular time frame: opening price, closing price, intraday high and low.

Horizontal levels are price coordinates, relative to which a price may stop or reverse its trajectory. In the market, these levels are called support and resistance.

Circles and rectangles are highlighted examples where the price reversed in history. This color highlighting indicates horizontal lines that may put pressure on the asset's price in the future.

The up/down arrows are landmarks of the possible price direction in the future.

Gven Podolsky,
انسٹافاریکس کا تجزیاتی ماہر
© 2007-2025
ٹائم فریم منتخب کریں
5
منٹ
15
منٹ
30
منٹ
1
گھنٹہ
4
گھنٹے
1
دن
1
ہفتہ
انسٹافاریکس کے ساتھ کرپٹو کرنسی کی معاملاتی تبدیلیوں سے کمائیں۔
میٹا ٹریڈر 4 ڈاؤن لوڈ کریں اور اپنی پہلی ٹریڈ کھولیں۔
  • Grand Choice
    Contest by
    InstaForex
    InstaForex always strives to help you
    fulfill your biggest dreams.
    مقابلہ میں شامل ہوں

تجویز کردہ مضامین

10 جون کو برطانوی پاؤنڈ/امریکی ڈالر کے لیے تجارتی سفارشات اور تجزیہ: پاؤنڈ کو گرنے کی کوئی جلدی نہیں ہے

برطانوی پاؤنڈ/امریکی ڈالر 5 منٹ کا تجزیہ پیر کو، برطانوی پاؤنڈ/امریکی ڈالر کرنسی کا جوڑا اپنی نیچے کی حرکت کو جاری رکھنے میں ممکنہ طور پر ناکام رہا۔ یاد کریں

Paolo Greco 13:43 2025-06-10 UTC+2

10 جون کو یورو/امریکی ڈالر کے لیے تجارتی سفارشات اور تجزیہ: ایک اور دن، منفی کی ایک اور خوراک

یورو/امریکی ڈالر کا 5 منٹ کا تجزیہ یورو/امریکی ڈالر کرنسی کے جوڑے کی پیر بھر میں مخلوط تجارت ہوئی۔ ٹرینڈ لائن کو توڑنے کے باوجود، نیچے کی طرف حرکت (یعنی

Paolo Greco 13:42 2025-06-10 UTC+2

9 جون کو برطانوی پاؤنڈ/امریکی ڈالر کے پیئر کی تجارت کیسے کی جائے؟ نئے افراد کے لیے آسان تجاویز اور تجارتی تجزیہ

جمعہ کی تجارت کا تجزیہ برطانوی پاؤنڈ/امریکی ڈالر کا 1گھنٹے کا چارٹ برطانوی پاؤنڈ/امریکی ڈالر کا جوڑا بھی جمعہ کو انہی وجوہات کی بناء پر کم تجارت کرتا

Paolo Greco 11:03 2025-06-09 UTC+2

9 جون کو یورو/امریکی ڈالر کے جوڑے کی تجارت کیسے کی جائے؟ نئے افراد کے لیے آسان تجاویز اور تجارتی تجزیہ

جمعہ کی تجارت کا تجزیہ یورو/امریکی ڈالر کا 1گھنٹے کا چارٹ یورو/امریکی ڈالر کرنسی کے جوڑے نے جمعہ کو کم تجارت کی، اور اس کی معروضی وجوہات تھیں۔ تاہم،

Paolo Greco 11:03 2025-06-09 UTC+2

9 جون کو برطانوی پاؤنڈ/امریکی ڈالر کے لیے تجارتی سفارشات اور تجزیہ: پاؤنڈ کے رجحان میں ایک بار پھر تبدیلی

جمعہ کو، برطانوی پاؤنڈ/امریکی ڈالر کرنسی جوڑا کم ٹریڈ کر رہا تھا، اور چونکہ ٹرینڈ لائن قیمت کے بہت قریب تھی، یہاں

Paolo Greco 10:59 2025-06-09 UTC+2

9 جون کو یورو/امریکی ڈالر کے لیے تجارتی سفارشات اور تجزیہ: اس بار ڈالر کب تک بڑھے گا؟

یورو/امریکی ڈالر کا 5 منٹ کا تجزیہ جمعہ کو، یورو/امریکی ڈالر کرنسی کے جوڑے نے اپنی نسبتاً ہلکی کمی کو جاری رکھا اور دن کا اختتام چڑھتے ہوئے جانے والے

Paolo Greco 10:58 2025-06-09 UTC+2

6 جون 2025 کو برطانوی پاؤنڈ/امریکی ڈالر کے لیے تجارتی سفارشات اور تجارتی تجزیہ

برطانوی پاؤنڈ/امریکی ڈالر 5 منٹ کا تجزیہ برطانوی پاؤنڈ/امریکی ڈالر کرنسی کے جوڑے نے جمعرات کو اپنی اوپر کی حرکت جاری رکھی، حالانکہ ایک بار پھر اس کی کوئی ظاہری

Paolo Greco 20:10 2025-06-06 UTC+2

6 جون 2025 کو یورو/امریکی ڈالر کے لیے تجارتی سفارشات اور تجارتی تجزیہ

یورو/امریکی ڈالر 5 منٹ کا تجزیہ یورو/امریکی ڈالر کی کرنسی جوڑے نے جمعرات کو فائدہ کے ساتھ تجارت جاری رکھی۔ ECB کی طرف سے تازہ ترین مانیٹری پالیسی میں نرمی

Paolo Greco 20:07 2025-06-06 UTC+2

یورو / یو ایس ڈی: 6 جون کو امریکی سیشن کے لیے تجارتی منصوبہ (صبح کی تجارت کا جائزہ)

اپنی صبح کی پیشن گوئی میں، میں نے 1.1407 کی سطح کو نمایاں کیا اور اس کی بنیاد پر مارکیٹ میں داخلے کے فیصلے کرنے کا منصوبہ بنایا۔ آئیے

Miroslaw Bawulski 18:56 2025-06-06 UTC+2

جی بی پی / یو ایس ڈی: 6 جون کو امریکی سیشن کے لیے تجارتی منصوبہ (صبح کی تجارت کا جائزہ)

اپنی صبح کی پیشن گوئی میں، میں نے 1.3544 کی سطح کو نمایاں کیا اور اس کی بنیاد پر مارکیٹ میں داخلے کے فیصلے کرنے کا منصوبہ بنایا۔ آئیے

Miroslaw Bawulski 18:44 2025-06-06 UTC+2
ابھی فوری بات نہیں کرسکتے ؟
اپنا سوال پوچھیں بذریعہ چیٹ.
Widget callback
 

Dear visitor,

Your IP address shows that you are currently located in the USA. If you are a resident of the United States, you are prohibited from using the services of InstaFintech Group including online trading, online transfers, deposit/withdrawal of funds, etc.

If you think you are seeing this message by mistake and your location is not the US, kindly proceed to the website. Otherwise, you must leave the website in order to comply with government restrictions.

Why does your IP address show your location as the USA?

  • - you are using a VPN provided by a hosting company based in the United States;
  • - your IP does not have proper WHOIS records;
  • - an error occurred in the WHOIS geolocation database.

Please confirm whether you are a US resident or not by clicking the relevant button below. If you choose the wrong option, being a US resident, you will not be able to open an account with InstaForex anyway.

We are sorry for any inconvenience caused by this message.