empty
19.04.2023 10:58 AM
Bitcoin recovers above $30k: Is the correction canceled?

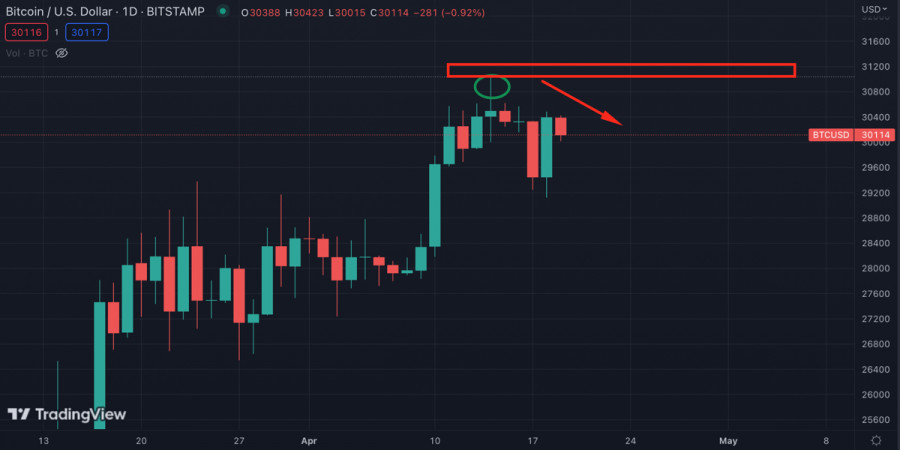
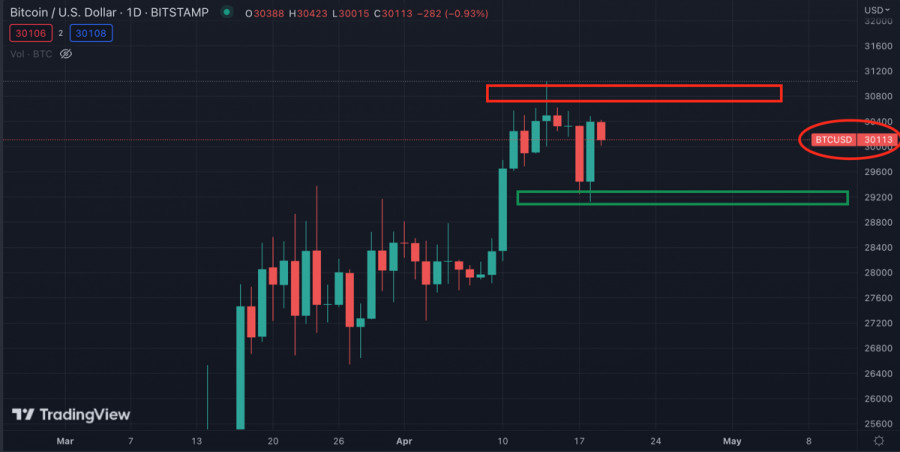
After BTC/USD reached the $30k level, the price moved to the consolidation phase. Subsequently, buyers managed to build up volume for a decisive bull run to $31.1k. However, when crossing the $31k level, the bulls had to face strong resistance from sellers.

As a result, the price began to decline and formed an uncertain "doji" candle, closing near the $30.4k level. The unsuccessful retest of $31k led to the activation of sellers and increased pressure on the price of Bitcoin.

This image is no longer relevant

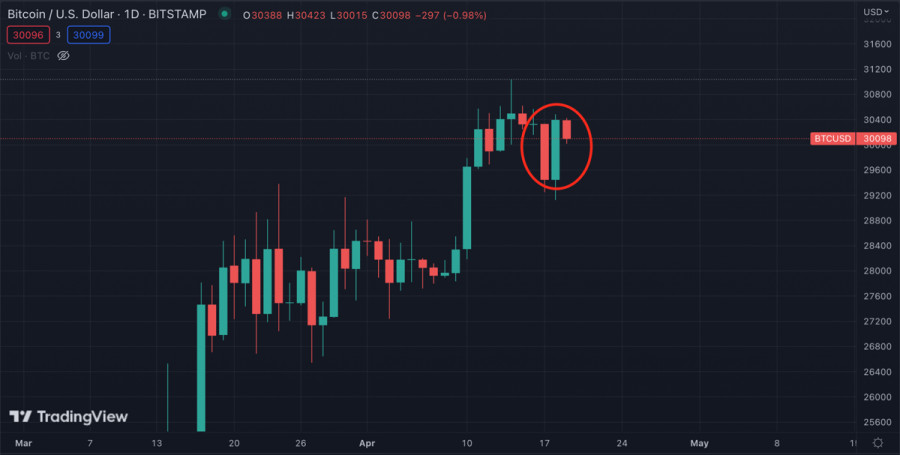
The build-up of bearish volumes resulted in Bitcoin's price breaking below the $30k level by the end of April 17. At the same time, a "bearish engulfing" pattern formed on the daily chart, which could mean the beginning of a corrective movement in the short term.

Has the bear market passed?

However, on April 18, the price of Bitcoin managed to recover above the $30k level and form a bullish engulfing pattern. This is an extremely bullish signal, indicating a weak bearish sentiment and the growing strength of the buyers.

This image is no longer relevant

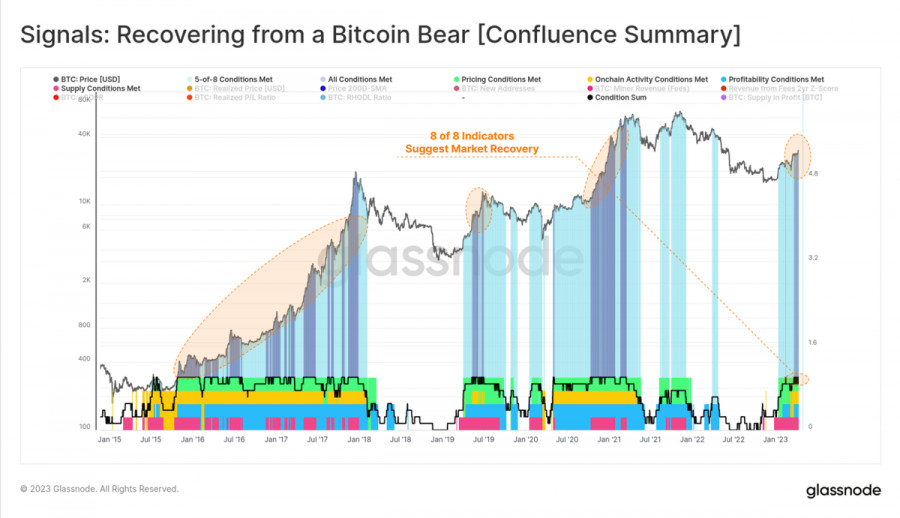
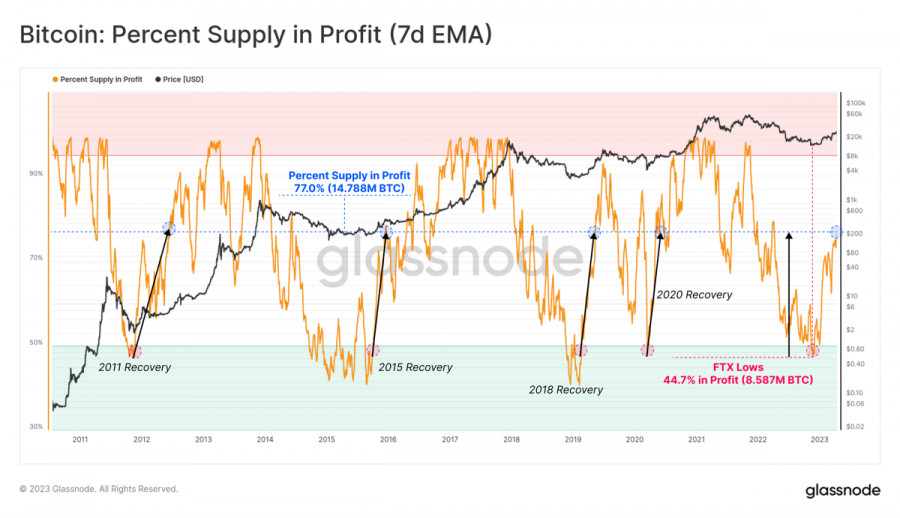
Glassnode analysts also note that all the main on-chain metrics of the cryptocurrency indicate the completion of the main and most painful stage of the bear market. There is also an upward trend in the use of the BTC network for transactions, which strengthens the cryptocurrency's position.

This image is no longer relevant

Separately, it is worth focusing on the reserve risk indicator, which measures the number of long-term holders of BTC coins. For the past year, the indicator has been below zero, but historically when the indicator exceeded 1, the price of Bitcoin has increased multiple times.

This image is no longer relevant

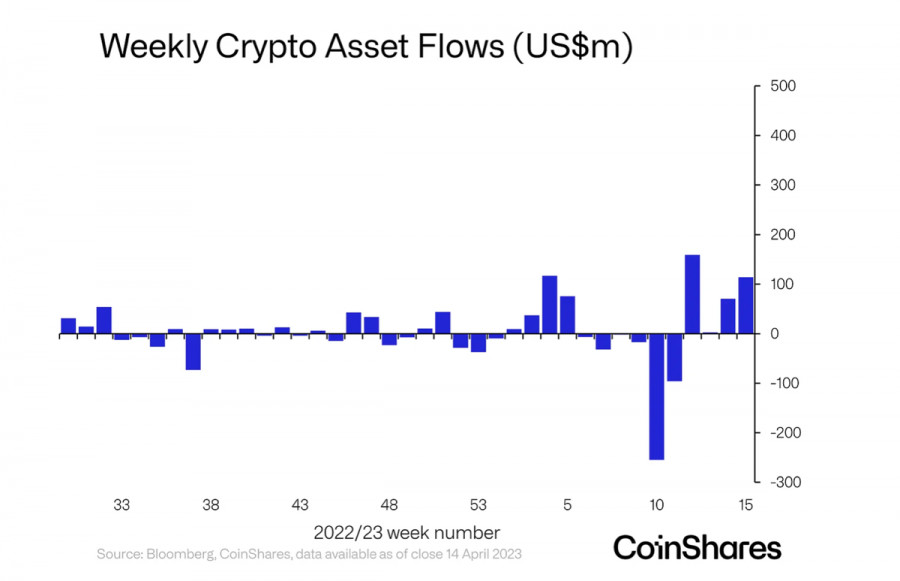
As of April 19, the reserve risk indicator is above zero, which may indicate an upcoming resumption of the upward movement. Analysts at CoinShares added positivity, noting an inflow of funds into crypto funds amounting to $114 million. The total inflow of investments in digital assets reached $345 million over the last four weeks.

This image is no longer relevant

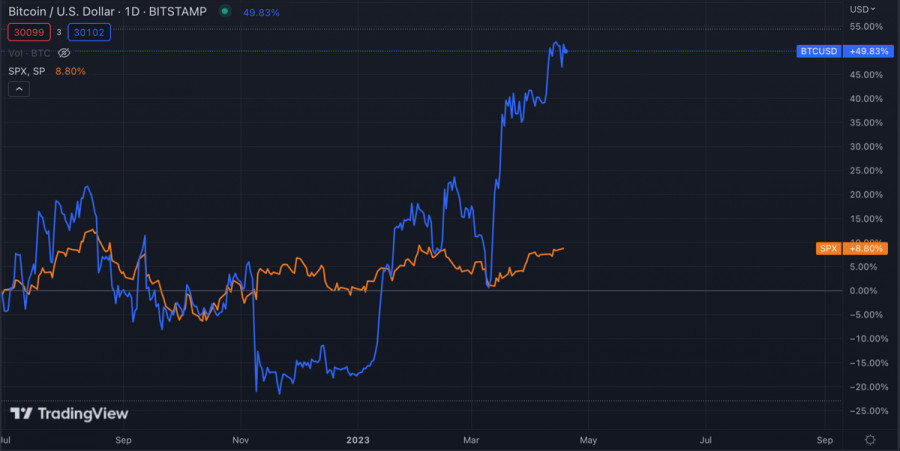
Despite the overall positivity, do not forget that BTC retains its correlation with the stock market. At JPMorgan, they continue to heat up the situation, saying that the U.S. stock rally is unjustified. The inflation issue and looming recession have not been resolved, so it is too early to talk about the crisis in the crypto market being over.

BTC/USD Analysis

As we noted, Bitcoin formed a "bullish engulfing" pattern and recovered above the $30k mark. However, the trading volume of the cryptocurrency and the number of unique addresses remain low, indicating an impulse recovery growth of BTC quotes.

This image is no longer relevant

In the coming days, it will become clear in which direction the BTC price will move. As of April 19, a consolidation period continues, with the main level being the $30k mark. By holding this level, the chances of BTC going for a retest of $31k are higher than a correction to $28k.

This image is no longer relevant

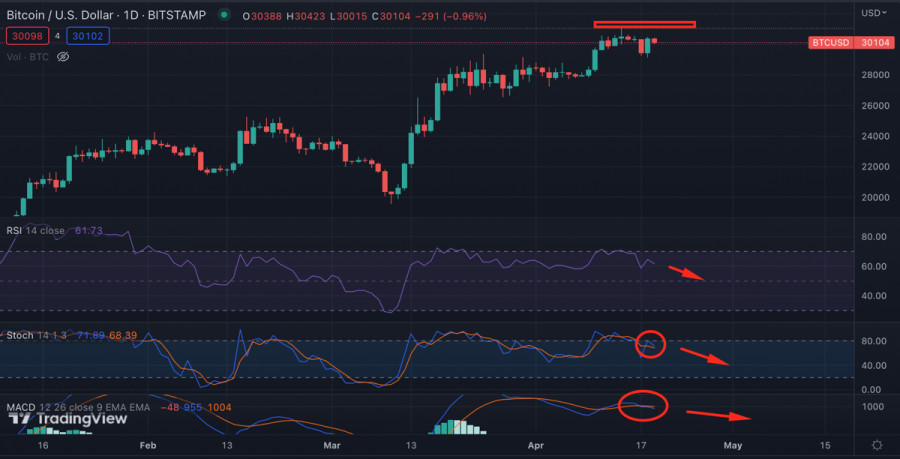
Technical metrics on the daily chart indicate a local weakening of the bulls' positions. The RSI has taken a downward direction, and the stochastic formed a bearish crossover, suggesting a further decline in price. Meanwhile, the MACD continues to implement a bearish crossover, indicating the weakness of BTC's bullish potential.

This image is no longer relevant

But this isn't to say that Bitcoin looks overheated, as the main metrics are within the bullish norm. On-chain indicators also point to the stability and consolidation of the cryptocurrency. However, BTC lacks large buyers to continue the upward movement.

Results

In the near future, the struggle for the $30k level will unfold, which will be characterized by impulsive price movements in both directions with a breakdown of key support levels. Correction should be considered as the main idea for the price movement only if BTC consolidates below $30k and continues its downward movement.

Artem Petrenko,
انسٹافاریکس کا تجزیاتی ماہر
© 2007-2025
ٹائم فریم منتخب کریں
5
منٹ
15
منٹ
30
منٹ
1
گھنٹہ
4
گھنٹے
1
دن
1
ہفتہ
انسٹافاریکس کے ساتھ کرپٹو کرنسی کی معاملاتی تبدیلیوں سے کمائیں۔
میٹا ٹریڈر 4 ڈاؤن لوڈ کریں اور اپنی پہلی ٹریڈ کھولیں۔
  • Grand Choice
    Contest by
    InstaForex
    InstaForex always strives to help you
    fulfill your biggest dreams.
    مقابلہ میں شامل ہوں

تجویز کردہ مضامین

بٹ کوائن نے $109,000 تک بہتری کی ہے

بٹ کوائن آج تیزی سے $109,000 کی سطح پر پہنچ گیا۔ یہ تیز رفتار اضافہ، خاص طور پر کل کے 106,600 ڈالر تک گرنے کے بعد،

Jakub Novak 19:29 2025-05-29 UTC+2

بٹ کوائن اور ایتھریم تیزی کی رفتار کو برقرار رکھتے ہیں۔

ایک مختصر وقفے کے باوجود، بٹ کوائن اور ایتھریم اپنی اوپر کی حرکت کے ساتھ ختم ہوتے دکھائی نہیں دیتے۔ جبکہ آج کے ایشیائی تجارتی سیشن کے دوران بٹ کوائن

Jakub Novak 17:03 2025-05-27 UTC+2

یہ کہ 27 مئی کو کرپٹو کرنسی مارکیٹ کے لیے تجارتی تجاویز

بٹ کوائن اور ایتھر کی مانگ اس ہفتے کے اوائل میں جاری ہے۔ بٹ کوائن $109,000 کے نشان سے اوپر رہتا ہے، جبکہ ایتھریم $2,600 سے اوپر کو مستحکم کرنے

Miroslaw Bawulski 16:22 2025-05-27 UTC+2

مئی 27 2025 کو بی ٹی سی تجزیہ

بی ٹی سی / یو ایس ڈی کی قدر میں گزشتہ سات ہفتوں کے دوران نمایاں اضافہ ہوا ہے، مانگ میں مسلسل اور مسلسل اضافہ ہو رہا ہے۔

Chin Zhao 16:12 2025-05-27 UTC+2

مئی 26 کو کرپٹو کرنسی مارکیٹ کے لیے تجارتی سفارشات

بٹ کوائن اور ایتھریم کی مانگ اس ہفتے کے آغاز میں واپس آگئی۔ بٹ کوائن $109,000 کی سطح سے اوپر ٹوٹ چکا ہے، جبکہ ایتھریم $2,550 کے نشان سے اوپر

Miroslaw Bawulski 14:35 2025-05-26 UTC+2

بٹ کوائن $107,000 سے اوپر موجود ہے۔

بٹ کوائن نے اپنی اوپر کی حرکت دوبارہ شروع کر دی ہے اور پچھلے ہفتے کے آخر میں $106,000 کی سطح پر ٹھوس اصلاح کے بعد پہلے ہی $109,900

Jakub Novak 14:18 2025-05-26 UTC+2

ریپل کریپٹو کرنسی کی انٹرا ڈے پرائس موومنٹ کا تکنیکی تجزیہ، جمعہ 23 مئی 2025۔

اگر ہم ریپل کریپٹو کرنسی کے 4 گھنٹے کے چارٹ کو دیکھیں تو یہ ڈبلیو ایم اے (21) سے اوپر کی طرف بڑھتا ہوا دکھائی دیتا

Arief Makmur 15:30 2025-05-23 UTC+2

ڈوج کریپٹو کرنسی کا یومیہ پرائس موومنٹ کا تکنیکی تجزیہ، جمعہ 23 مئی 2025۔

ایسا لگتا ہے کہ 4 گھنٹے کے چارٹ پر ڈوج کریپٹو کرنسی کی قیمت کی حرکت ڈبلیو ایم اے (21) سے اوپر جا رہی ہے جس کی ایک ڈھلوان

Arief Makmur 14:14 2025-05-23 UTC+2

مئی 9 کو کرپٹو کرنسی مارکیٹ کے لیے تجارتی سفارشات

بٹ کوائن $100,000 سے اوپر چڑھ چلا گیا ہے، جبکہ ایتھریم $2,000 سے اوپر کو مستحکم کرنے کی کوشش کر رہا ہے۔ کل کی تیز ریلی کے بعد،

Miroslaw Bawulski 20:19 2025-05-09 UTC+2
ابھی فوری بات نہیں کرسکتے ؟
اپنا سوال پوچھیں بذریعہ چیٹ.
Widget callback
 

Dear visitor,

Your IP address shows that you are currently located in the USA. If you are a resident of the United States, you are prohibited from using the services of InstaFintech Group including online trading, online transfers, deposit/withdrawal of funds, etc.

If you think you are seeing this message by mistake and your location is not the US, kindly proceed to the website. Otherwise, you must leave the website in order to comply with government restrictions.

Why does your IP address show your location as the USA?

  • - you are using a VPN provided by a hosting company based in the United States;
  • - your IP does not have proper WHOIS records;
  • - an error occurred in the WHOIS geolocation database.

Please confirm whether you are a US resident or not by clicking the relevant button below. If you choose the wrong option, being a US resident, you will not be able to open an account with InstaForex anyway.

We are sorry for any inconvenience caused by this message.