signal strength 1 of 5

The Double Bottom pattern has been formed on #Bitcoin M5; the upper boundary is 84198.05; the lower boundary is 83772.49. The width of the pattern is 43677 points. In case of a break of the upper boundary 84198.05, a change in the trend can be predicted where the width of the pattern will coincide with the distance to a possible take profit level.
The M5 and M15 time frames may have more false entry points.
- All
- Double Top
- Flag
- Head and Shoulders
- Pennant
- Rectangle
- Triangle
- Triple top
- All
- #AAPL
- #AMZN
- #Bitcoin
- #EBAY
- #FB
- #GOOG
- #INTC
- #KO
- #MA
- #MCD
- #MSFT
- #NTDOY
- #PEP
- #TSLA
- #TWTR
- AUDCAD
- AUDCHF
- AUDJPY
- AUDUSD
- EURCAD
- EURCHF
- EURGBP
- EURJPY
- EURNZD
- EURRUB
- EURUSD
- GBPAUD
- GBPCHF
- GBPJPY
- GBPUSD
- GOLD
- NZDCAD
- NZDCHF
- NZDJPY
- NZDUSD
- SILVER
- USDCAD
- USDCHF
- USDJPY
- USDRUB
- All
- M5
- M15
- M30
- H1
- D1
- All
- Buy
- Sale
- All
- 1
- 2
- 3
- 4
- 5

Corak Double Bottom telah dibentuk pada #FB D1. Ciri-ciri: tahap sokongan 482.05; tahap rintangan 587.72; lebar corak 10567 mata. Sekiranya tahap rintangan ditembusi, perubahan aliran boleh diramalkan dengan titik sasaran
Open chart in a new window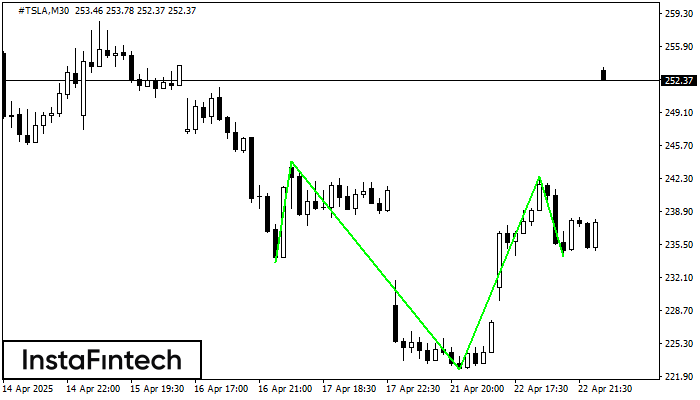
According to M30, #TSLA is shaping the technical pattern – the Inverse Head dan Shoulder. In case the Neckline 244.08/242.52 is broken out, the instrument is likely to move toward
Open chart in a new window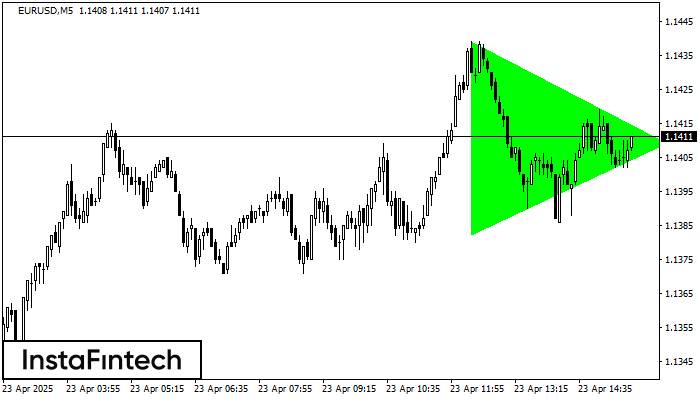
Berdasarkan carta M5, EURUSD membentuk corak Segi Tiga Simetri Menaik. Sempadan yang lebih rendah bagi corak yang menyentuh koordinat 1.1382/1.1409 di mana sempadan atas merentasi 1.1439/1.1409. Sekiranya corak Segi Tiga
Carta masa M5 dan M15 mungkin mempunyai lebih banyak titik kemasukan palsu.
Open chart in a new window