

signal strength 1 of 5

According to the chart of M5, NZDCAD formed the Inverse Head and Shoulder pattern. The Head’s top is set at 0.7878 while the median line of the Neck is found at 0.7826/0.7858. The formation of the Inverse Head and Shoulder pattern evidently signals a reversal of the downward trend. In other words, in case the scenario comes true, the price of NZDCAD will go towards 0.7893
The M5 and M15 time frames may have more false entry points.
- All
- Double Top
- Flag
- Head and Shoulders
- Pennant
- Rectangle
- Triangle
- Triple top
- All
- #AAPL
- #AMZN
- #Bitcoin
- #EBAY
- #FB
- #GOOG
- #INTC
- #KO
- #MA
- #MCD
- #MSFT
- #NTDOY
- #PEP
- #TSLA
- #TWTR
- AUDCAD
- AUDCHF
- AUDJPY
- AUDUSD
- EURCAD
- EURCHF
- EURGBP
- EURJPY
- EURNZD
- EURRUB
- EURUSD
- GBPAUD
- GBPCHF
- GBPJPY
- GBPUSD
- GOLD
- NZDCAD
- NZDCHF
- NZDJPY
- NZDUSD
- SILVER
- USDCAD
- USDCHF
- USDJPY
- USDRUB
- All
- M5
- M15
- M30
- H1
- D1
- All
- Buy
- Sale
- All
- 1
- 2
- 3
- 4
- 5

По торговому инструменту GBPCHF на H1 была сформирована графическая фигура «Тройное дно» с характеристиками: Уровень сопротивления 1.0988; Уровень поддержки 1.0919; Ширина 69 пунктов. В случае пробоя уровня сопротивления 1.0997 котировка
Открыть график инструмента в новом окне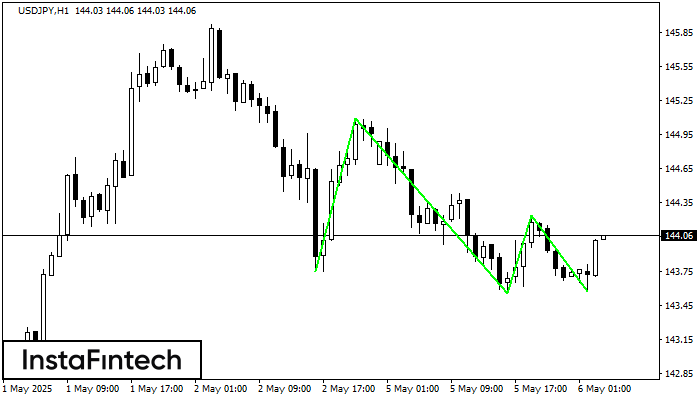
По USDJPY на H1 сформировалась фигура «Тройное дно». Характеристика: Нижняя граница фигуры имеет координаты 143.57, при этом верхняя граница 145.09/144.24. Проекция ширины 154 пунктов. Формирование фигуры «Тройное дно» наиболее вероятным
Открыть график инструмента в новом окне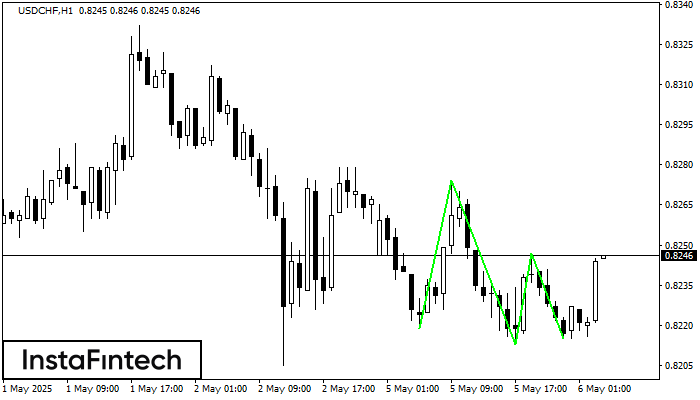
Сформирована фигура «Тройное дно» по торговому инструменту USDCHF на H1. Фигура сигнализирует об изменении тенденции с нисходящей на восходящую в случае пробоя верхней границы 0.8247
Открыть график инструмента в новом окне


