signal strength 2 of 5
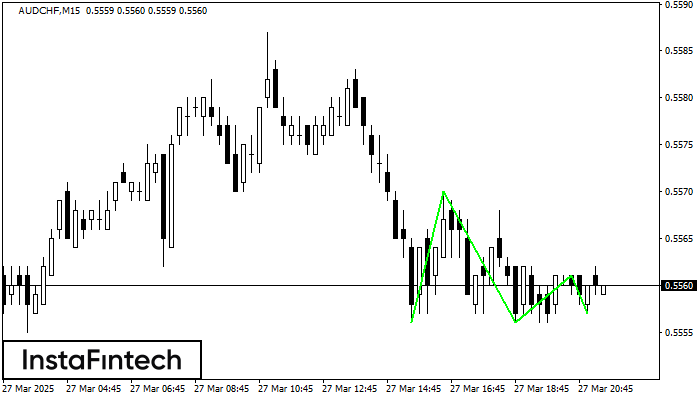
The Triple Bottom pattern has formed on the chart of AUDCHF M15. Features of the pattern: The lower line of the pattern has coordinates 0.5570 with the upper limit 0.5570/0.5561, the projection of the width is 14 points. The formation of the Triple Bottom pattern most likely indicates a change in the trend from downward to upward. This means that in the event of a breakdown of the resistance level 0.5556, the price is most likely to continue the upward movement.
The M5 and M15 time frames may have more false entry points.
Juga lihat
- All
- Double Top
- Flag
- Head and Shoulders
- Pennant
- Rectangle
- Triangle
- Triple top
- All
- #AAPL
- #AMZN
- #Bitcoin
- #EBAY
- #FB
- #GOOG
- #INTC
- #KO
- #MA
- #MCD
- #MSFT
- #NTDOY
- #PEP
- #TSLA
- #TWTR
- AUDCAD
- AUDCHF
- AUDJPY
- AUDUSD
- EURCAD
- EURCHF
- EURGBP
- EURJPY
- EURNZD
- EURRUB
- EURUSD
- GBPAUD
- GBPCHF
- GBPJPY
- GBPUSD
- GOLD
- NZDCAD
- NZDCHF
- NZDJPY
- NZDUSD
- SILVER
- USDCAD
- USDCHF
- USDJPY
- USDRUB
- All
- M5
- M15
- M30
- H1
- D1
- All
- Buy
- Sale
- All
- 1
- 2
- 3
- 4
- 5
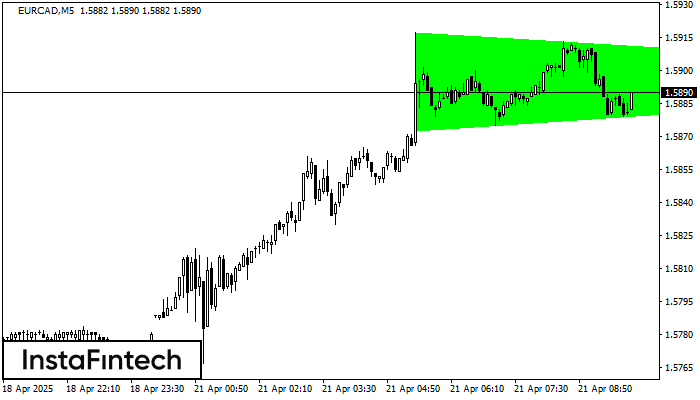
Berdasarkan carta M5, EURCAD membentuk corak Segi Tiga Simetri Menaik. Penerangan: Ini adalah corak kesinambungan aliran. 1.5917 dan 1.5872 adalah koordinat sempadan atas dan bawah masing-masing. Lebar corak diukur pada
Carta masa M5 dan M15 mungkin mempunyai lebih banyak titik kemasukan palsu.
Open chart in a new window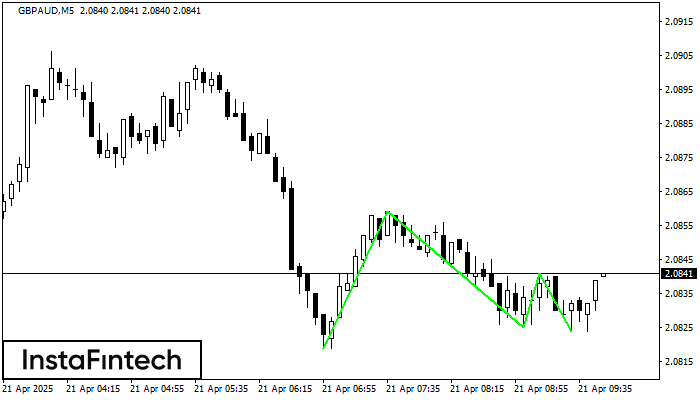
Corak Triple Bottom telah dibentuk pada carta bagi instrumen dagangan GBPAUD M5. Corak menandakan perubahan aliran dari menurun ke aliran menaik dalam sekiranya penembusan 2.0859/2.0841
Carta masa M5 dan M15 mungkin mempunyai lebih banyak titik kemasukan palsu.
Open chart in a new window
Corak grafik Pennant Aliran Menaik telah terbentuk pada instrumen NZDCAD M30. Jenis corak ini berada di bawah kategori corak kesinambungan. Dalam situasi ini, sekiranya penetapan harga boleh menembusi tinggi, adalah
Open chart in a new window