empty
03.02.2025 12:33 PM
Weekly Forecast Based on Simplified Wave Analysis for EUR/USD, USD/JPY, GBP/JPY, USD/CAD, NZD/USD, and Bitcoin – February 3

EUR/USD

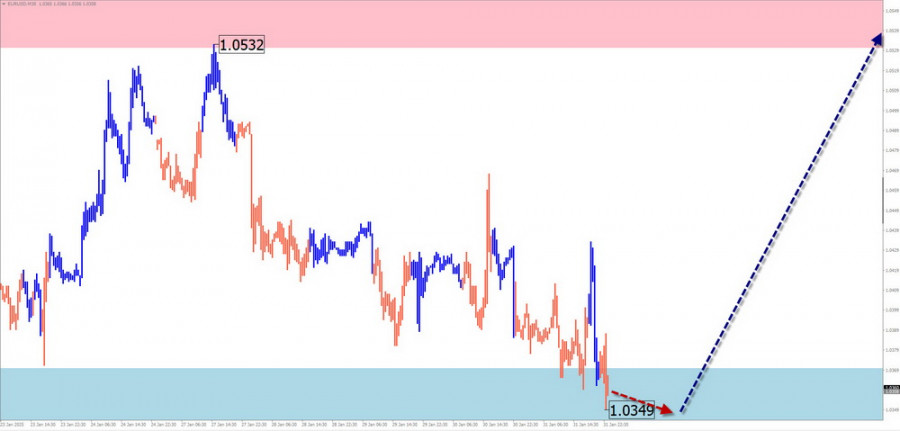
Analysis:Since October of last year, the euro's price movement has followed a downward wave algorithm. A counter-correction has been forming since the start of the year, taking the shape of an extended flat pattern, which is nearing completion. The resistance zone aligns with the lower boundary of a potential large-scale reversal zone.

Forecast:In the first half of the upcoming week, further pressure on the euro toward the support zone is likely. A pause and potential reversal may occur in this area, with a resumption of upward movement expected by the end of the week.

This image is no longer relevant

Potential Reversal Zones:

  • Resistance: 1.0530 / 1.0580
  • Support: 1.0370 / 1.0320

Recommendations:

  • Buy: Consider after confirmed reversal signals near the support zone.
  • Sell: No potential; likely to result in losses.

USD/JPY

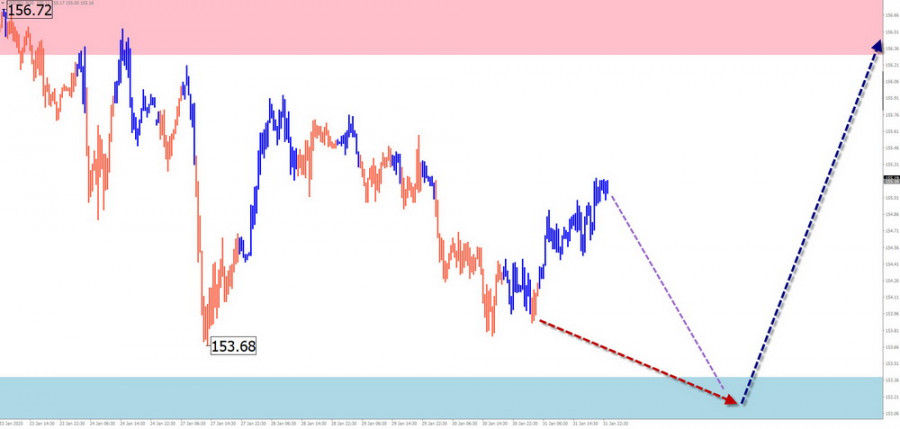
Analysis:The bullish wave for the Japanese yen began in August of last year. Since December, a counter-correction (B) has been developing, which remains incomplete at the time of analysis. Over the past week, the pair has formed a potential upward reversal wave pattern.

Forecast:In the next few days, expect a sideways movement with a gradual shift toward the support zone. The second half of the week could bring increased volatility, with a possible reversal and resumption of the uptrend.

This image is no longer relevant

Potential Reversal Zones:

  • Resistance: 156.30 / 156.80
  • Support: 153.40 / 152.90

Recommendations:

  • Buy: Possible with small volume sizes after confirmed reversal signals within the support zone.
  • Sell: Intraday positions with small volume sizes; close trades at the first signs of reversal.

GBP/JPY

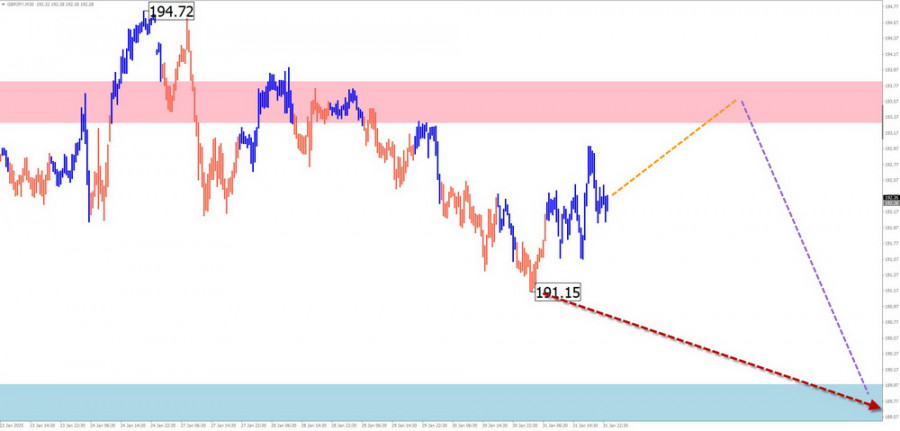
Analysis:On the GBP/JPY pair, the most notable wave for trading is the unfinished upward wave from December 3 of last year. Since January 13, the final part (C) has been forming, creating a shifting flat pattern.

Forecast:In the upcoming week, expect the pair to move sideways. A downward movement toward the support zone is possible in the first few days, with a resumption of upward momentum expected closer to the weekend.

This image is no longer relevant

Potential Reversal Zones:

  • Resistance: 193.30 / 193.80
  • Support: 191.00 / 190.50

Recommendations:

  • Sell: Intraday positions with small volume sizes.
  • Buy: After confirmed reversal signals in the support zone, buying becomes the priority for trading.

USD/CAD

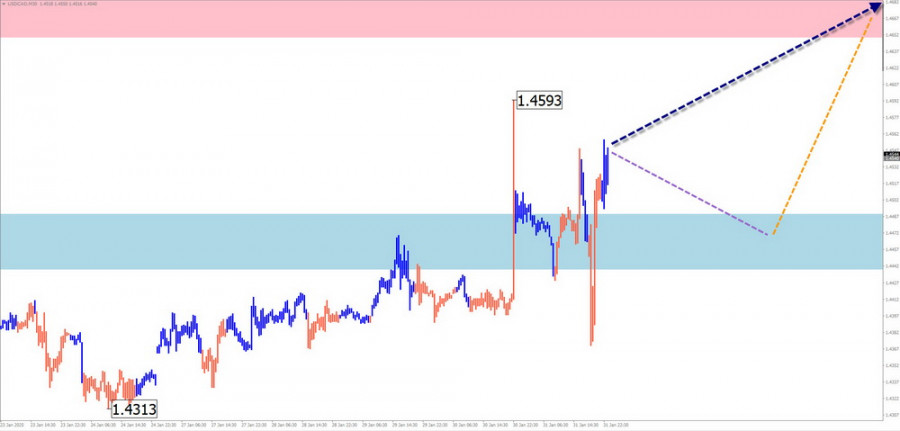
Analysis:Since late September, the uptrend in USD/CAD has followed an ascending wave algorithm. After a flat correction that ended two weeks ago, the price is now forming the final upward leg. Recently, the pair broke through strong resistance, which has now become support.

Forecast:Following a possible pullback and pressure on the support zone, a reversal and return to the general uptrend can be expected. The resistance zone marks the upper boundary of a potential weekly reversal zone.

This image is no longer relevant

Potential Reversal Zones:

  • Resistance: 1.4650 / 1.4700
  • Support: 1.4490 / 1.4440

Recommendations:

  • Sell: Risky under current market conditions.
  • Buy: Possible with small volume sizes after confirmed reversal signals near the support zone.

NZD/USD

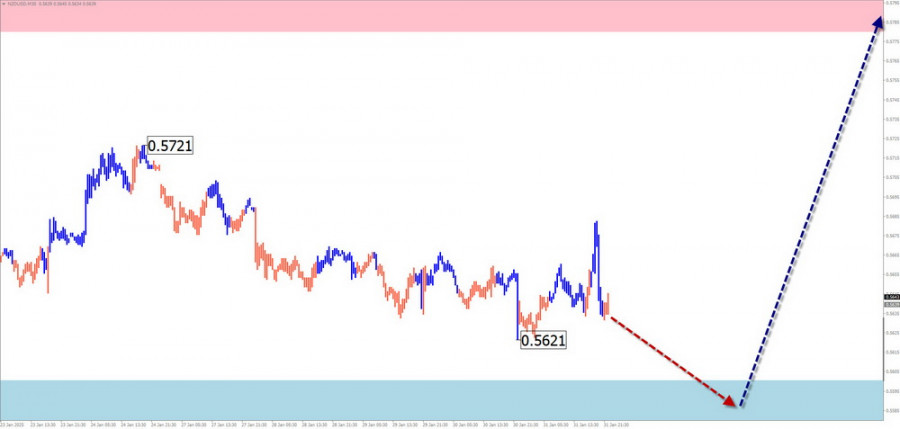
Analysis:The unfinished wave structure in NZD/USD has a downward trajectory that began in mid-July last year. The corrective wave (B) started in December and remains incomplete. Prices are near the boundaries of a potential reversal zone.

Forecast:In the coming days, a reversal formation near the support zone is likely. Some downward pressure and a brief decline below support may occur, with increased activity expected closer to the weekend.

This image is no longer relevant

Potential Reversal Zones:

  • Resistance: 0.5780 / 0.5830
  • Support: 0.5600 / 0.5550

Recommendations:

  • Sell: No favorable conditions expected this week.
  • Buy: Possible after confirmed reversal signals near the support zone.

Bitcoin

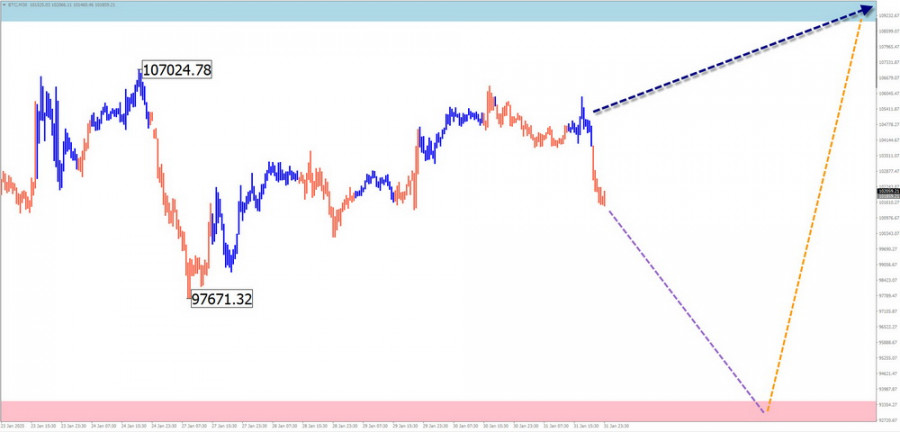
Analysis:Since August of last year, Bitcoin's price fluctuations have followed an upward wave algorithm. A counter-wave (B) has been developing since mid-December, with prices moving sideways within a potential weekly reversal zone. The wave structure is not yet complete.

Forecast:At the start of the week, Bitcoin's price is likely to decline toward the support zone. After forming a reversal, expect price growth toward the resistance zone.

This image is no longer relevant

Potential Reversal Zones:

  • Resistance: 109,000.0 / 110,000.0
  • Support: 94,500.0 / 93,500.0

Recommendations:

  • Sell: Possible with small volume sizes during individual sessions but with limited potential.
  • Buy: Becomes relevant after confirmed reversal signals near the support zone.

Explanation:

In Simplified Wave Analysis (SWA), all waves consist of three parts (A-B-C). The last, incomplete wave is analyzed on each time frame. Dotted lines indicate expected price movements.

Note: The wave algorithm does not account for the duration of price movements over time!

EURUSD
Euro vs US Dollar
Ringkasan
Neutral
Segera
1 minggu
Analitic
Vyacheslav Ognev
Mulakan perdagangan
Jana pendapatan melalui perubahan kadar mata wang kripto dengan InstaForex.
Muat turun MetaTrader 4 dan buka dagangan pertama anda.
  • Grand Choice
    Contest by
    InstaForex
    InstaForex always strives to help you
    fulfill your biggest dreams.
    SERTAI PERADUAN

Artikel yang dicadangkan

Analisis EUR/USD pada 5 Jun 2025

Corak gelombang pada carta 4 jam bagi pasangan EUR/USD telah berubah menjadi struktur menaik dan terus mengekalkan formasi ini. Saya percaya tidak banyak keraguan bahawa transformasi ini berlaku semata-mata akibat

Chin Zhao 20:03 2025-06-05 UTC+2

Analisis GBP/USD pada 4 Jun 2025

Corak gelombang bagi pasangan GBP/USD terus menunjukkan pembentukan struktur gelombang impulsif menaik. Gambar rajah gelombang hampir sama dengan pasangan EUR/USD. Sehingga 28 Februari, kita menyaksikan pembentukan struktur pembetulan yang meyakinkan

Chin Zhao 18:48 2025-06-04 UTC+2

Analisis EUR/USD pada 3 Jun 2025

Corak gelombang pada carta 4 jam bagi EUR/USD telah berubah menjadi struktur menaik dan kekal sedemikian. Saya percaya tidak ada keraguan bahawa perubahan ini berlaku semata-mata disebabkan dasar perdagangan baharu

Chin Zhao 19:38 2025-06-03 UTC+2

Analisis GBP/USD pada 3 Jun 2025

Struktur gelombang untuk GBP/USD terus menunjukkan perkembangan corak gelombang impulsif ke atas. Corak gelombang ini hampir sama dengan pasangan EUR/USD. Sehingga 28 Februari, kami menyaksikan pembentukan struktur pembetulan yang meyakinkan

Chin Zhao 19:32 2025-06-03 UTC+2

Analisis EUR/USD pada 2 Jun 2025

Struktur gelombang pada carta 4 jam untuk EUR/USD telah berubah menjadi formasi menaik dan terus mengekalkan bentuk tersebut. Saya percaya tidak ada keraguan bahawa transformasi ini berlaku semata-mata disebabkan dasar

Chin Zhao 19:07 2025-06-02 UTC+2

Analisis GBP/USD pada 2 Jun 2025

Struktur gelombang untuk GBP/USD terus menunjukkan pembentukan corak gelombang impuls kenaikan. Corak gelombang ini cerminan dengan EUR/USD. Hingga 28 Februari, kita menyaksikan pembentukan struktur pembetulan yang meyakinkan dengan sedikit keraguan

Chin Zhao 19:05 2025-06-02 UTC+2

Ramalan Mingguan Berdasarkan Analisis Gelombang Ringkas untuk GBP/USD, AUD/USD, USD/CHF, EUR/JPY, EUR/GBP dan Indeks Dolar AS pada 2 Jun

Sepanjang minggu hadapan, pound British dijangka bergerak dari zon semasanya menuju ke kawasan rintangan yang telah dikira. Pada awal minggu, dijangkakan vektor penurunan dengan tekanan berpotensi ke arah zon sokongan

Isabel Clark 11:53 2025-06-02 UTC+2

Ramalan Mingguan Berdasarkan Analisis Gelombang Ringkas untuk EUR/USD, USD/JPY, GBP/JPY, USD/CAD, NZD/USD, dan Emas pada 2 Jun

Dalam hari-hari yang akan datang, euro dijangka terus bergerak secara mendatar. Penurunan jangka pendek ke arah zon sokongan adalah mungkin. Selepas itu, terdapat kemungkinan untuk pembentukan bagi pembalikan arah. Permulaan

Isabel Clark 11:48 2025-06-02 UTC+2

Analisis EUR/USD pada 29 Mei 2025

Corak gelombang pada carta 4 jam untuk EUR/USD telah berubah menjadi struktur menaik dan kekal dalam bentuk tersebut. Adalah jelas bahawa perubahan ini berlaku semata-mata disebabkan oleh dasar perdagangan baharu

Chin Zhao 20:18 2025-05-29 UTC+2

Analisis GBP/USD pada 29 Mei 2025

Struktur gelombang bagi pasangan mata wang GBP/USD kekal menunjukkan pembentukan pola gelombang impulsif menaik. Konfigurasi gelombang ini hampir sama dengan EUR/USD. Sehingga 28 Februari, pasaran telah membentuk struktur pembetulan yang

Chin Zhao 20:17 2025-05-29 UTC+2
Tidak boleh bertanya sekarang?
Tanya soalan anda di Ruangan bersembang.
Panggilan semula Widget
 

Dear visitor,

Your IP address shows that you are currently located in the USA. If you are a resident of the United States, you are prohibited from using the services of InstaFintech Group including online trading, online transfers, deposit/withdrawal of funds, etc.

If you think you are seeing this message by mistake and your location is not the US, kindly proceed to the website. Otherwise, you must leave the website in order to comply with government restrictions.

Why does your IP address show your location as the USA?

  • - you are using a VPN provided by a hosting company based in the United States;
  • - your IP does not have proper WHOIS records;
  • - an error occurred in the WHOIS geolocation database.

Please confirm whether you are a US resident or not by clicking the relevant button below. If you choose the wrong option, being a US resident, you will not be able to open an account with InstaForex anyway.

We are sorry for any inconvenience caused by this message.