


Can technical indicators predict a further movement of an asset? The question is debatable. However, among traders, there are keen followers of technical analysis.
Let's find out what signals technical indicators can give and what they can tell us about the current and future market situation. In this article, we will discuss the Death Cross pattern and find out how to trade using it.
To learn more about other methods of market analysis, searching for entry points, and predicting price movements, see the article "What is trading".
Moving averages
Moving averages are one of the most well-known and frequently used trend indicators. They are easy to use and can be applied both individually and in combination with other indicators.
Moving averages, as well as other indicators of this category, have one important feature which is a lag. It means that the signals they give are received with some delay. That is why traders enter the market not at the very beginning of the trend movement.
On the one hand, the signal in such a situation becomes more reliable as the trend has already settled in the market. On the other hand, it is impossible to predict how long the new trend will last, so it is possible to enter a position too late.
Such features of moving averages as lagging show that it is rather difficult to use them as a prognostic indicator. They can only be used to analyze the current market situation.
However, owing to the smoothing of daily fluctuations and price noise, this indicator is able to determine rather precisely the current trend in the market. The reason is that moving averages are calculated on the basis of the averaging of the asset value for a certain period.
As a rule, closing prices are used for calculations, i.e. asset value at the moment of a candle closing, which marks a certain period, as a rule, it is a day. However, this indicator can also be calculated based on other indicators: opening prices, highs, and lows of the price, as well as typical and weighted average prices.
Functions of MAs
Moving averages are very popular among traders for a reason. They perform a number of important functions. Let us consider the main functions in detail.
1. Detect the current trend. As we have already mentioned, moving averages are not able to predict the future situation because of lagging, but they clearly confirm the current situation.
There is a rule allowing us to define the prevailing trend: if MA is situated above the chart line, the trend is downward, and vice versa, when the price chart is situated above MA, the trend is upward.
2. Act as dynamic support and resistance levels. In order to fulfill this function, it is necessary to choose certain periods. As a rule, the 50- or 200-period moving averages are support and resistance lines.
The moving average becomes a support level, if it is below the chart line. In this situation, the points where MA touches the chart may be used to open long positions.
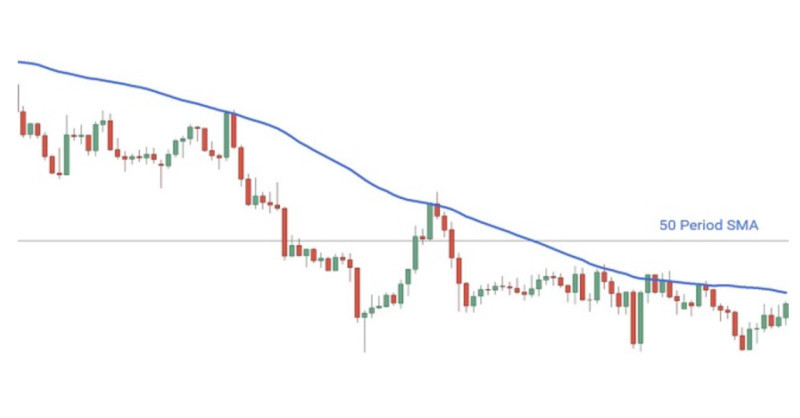
If the moving average is above the price chart, it acts as resistance. The points where MA touches the chart can be used for opening short positions.
3. Act as reference points for setting defensive orders. Moving averages have features, which allow us to determine the most appropriate points for setting the stop loss orders.
This, in turn, allows users to close losing positions. For example, when opening buy orders, a stop loss is set below the moving averages.
Varieties of MAs
MAs are fully customizable indicators, i.e. they can be adjusted according to each user's individual needs. A choice of time frame or moving average period is one of the main settings. The time period is used to calculate this indicator. For example, if you need to calculate a price for the last 10 days or periods, select a 10-period MA. If you need to calculate a price for 100 periods, use a 100-period MA.
In the case when a 10-period MA is calculated and the 11th period comes, the old value of the first period is simply removed from the calculation, and instead, the value of the 11th period is added.
That is why this indicator is called a moving average, because its value changes every day. In other words, every day, it shifts one value forward.
If large time intervals are applied, calculations could take quite a long time. However, modern trading platforms allow you to make all the calculations almost instantly and in an automatic mode.
In addition to different periods, you can also choose the method of calculating the moving average itself. There are several basic varieties:
1. A simple moving average (SMA) is calculated on the basis of the sum of the value of the asset for the chosen period of time, which is divided by the number of periods. That is, if we choose a 10-period MA, the sum of prices for the last 10 periods is divided by their number, that is 10;
2. An Exponential Moving Average (EMA) is calculated in a similar way. However, it is necessary to pay more attention to the later figures of the value. This means that if 100 periods are used for the calculation, the first 50 will have the lowest value in the calculation, and the last 50 will have the highest value.
MAs intersections
Earlier, we have already talked about functions, which are performed by moving averages independently of a price chart. There is another way of interaction: moving averages cross the chart and intersect each other.
If a moving average is above a chart line, the trend is descending. What will happen if the two lines intersect? When the price upwardly crosses the moving average, we get a signal to open a buy position.
If the moving average is below the price chart, this indicates that the upward trend prevails. If the price downwardly crosses the MA, this is regarded as a signal to open a short position, i.e. to sell.
However, in reality, it is not that simple and obvious. That is why many traders often add several moving averages with different periods to the charts. It allows them to receive more exact signals.
Very often two MAs are overlaid on the chart: a short-term (e.g. 20-period) and a long-term one (e.g. 50-period). The intersection of these two lines, rather than the MA and the chart itself, is used as a signal to open a trade.
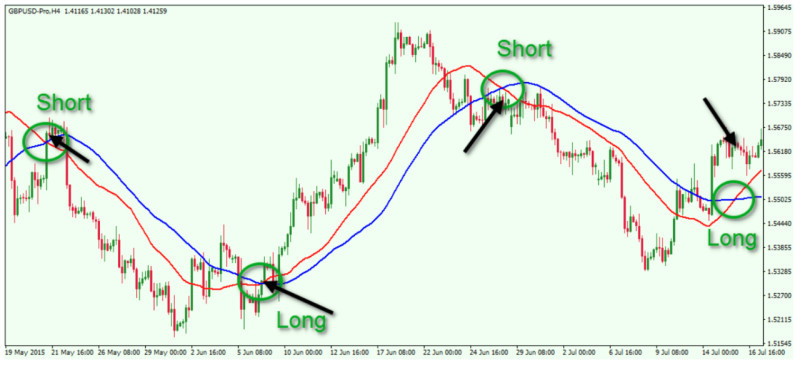
Thus, when the fast moving average upwardly crosses the slow one, it indicates a bullish trend. Accordingly, it is possible to open a buy position.
When the short-term MA crosses the long-term MA in the opposite direction, i.e. downward, it indicates the dominance of a bearish trend. As a consequence, it is recommended to open a sell position.
What is a Death Cross on the chart?
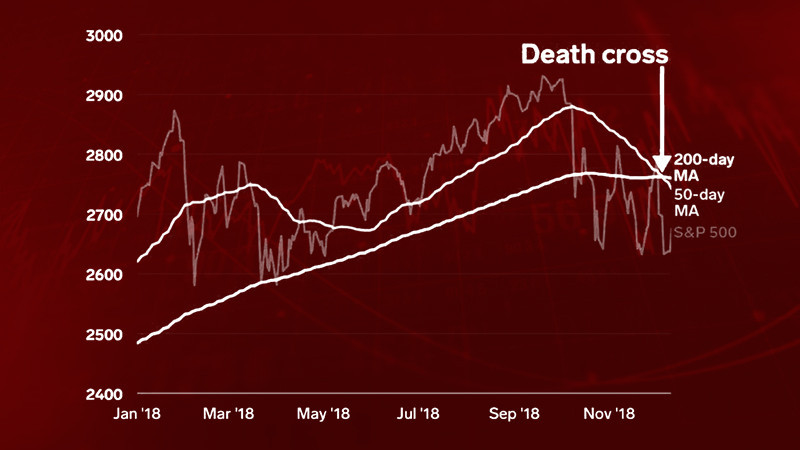
When two MAs intersect each other, they form the Golden Cross and Death Cross patterns, which are familiar to traders. Let's take a closer look at the formation of the Death Cross pattern and trading with its use.
In order to get this pattern on the chart, you need to superimpose two moving averages on it. For the first moving average, as a rule, traders choose a period of 50 (short-term or fast MA), and for the second one, they choose a period of 200 (long-term or slow MA).
The intersection of these two lines forms the pattern in question. However, it takes some time. The formation of the Death Cross pattern has several stages.
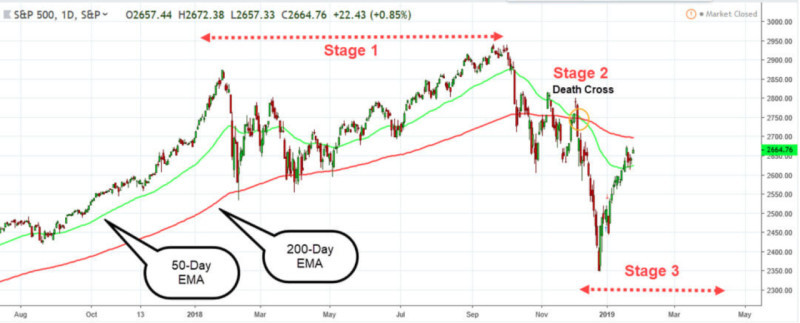
1. There is an uptrend in the market. Thus, a fast MA is higher than a slow MA;
2. Then, there is a change from the dominating trend to the opposite. This is proved by the downward crossing of the 50-period moving average by the 200-period MA ;
3. The bearish trend is established in the market if the fast moving average is under the slow one and the distance between them is becoming bigger.
Of course, the 50-period line can hardly be called a short-term one, because 50 days or periods is a rather long term. That is why this pattern gives a signal with a long delay.
Some traders prefer to use shorter periods for moving averages, such as 50 and 100, 20 and 100, or 20 and 50. This is done in order to get more frequent signals. However, it should be remembered that some of the signals could be false.
To confirm entry into the trade, it is necessary to use additional indicators, which may confirm the possibility of opening a short position.
Death Cross
So how can you trade and make a profit using the Death Cross pattern? Trading with the use of this pattern has a number of peculiarities. Let us consider them in detail.
The pattern is easy enough to apply. Thus, it can be used in trading even by novice traders. Nevertheless, it is necessary to follow some simple rules.
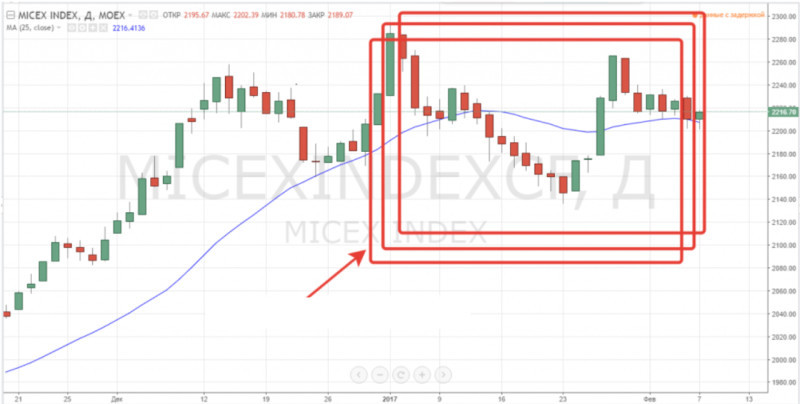
First, the Death Cross pattern can give false signals. This can happen for two main reasons. The first one is the absence of a clear directional movement, i.e. the beginning of a consolidation period in the market.
We have already mentioned that a moving average is a trend indicator. That is why it may work only if the market has a clear trend.
The second reason is the choice of a too short time frame. On low time frames, there are many price fluctuations, which eventually create noise. For this reason, the indicator can give false signals.
To get more reliable signals, traders should choose longer time frames. Even if the user trades on a chart with a lower time frame, the overall situation should be checked on a higher one.
So, we have already found out that the Death Cross pattern indicates a downward trend in the market. This means that traders can open sell orders.
In addition, the pattern can be used as a signal to close orders opened earlier after the formation of the Golden Cross on the chart, that is long positions.
Comparison to Golden Cross
This pattern is very similar to the Golden Cross by the way it is formed, the signals it provides, and the way traders enter the market.
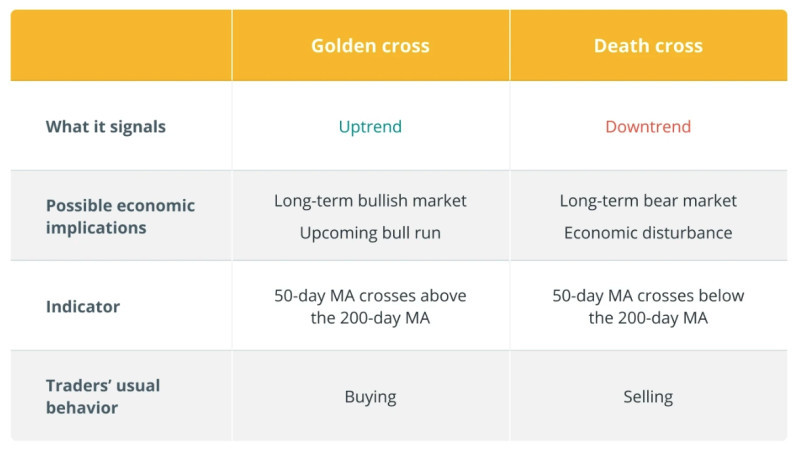
The two patterns are fundamentally different: one indicates an upward trend while the other indicates a downward trend. In addition, these two patterns complement each other.
If the trader opens a long position after the Golden Cross appears, it is recommended to close it once the opposite pattern, the Cross of Death, forms on the chart.
Conversely, if the trader opens a sell trade on the Death Cross signal, it is recommended to close the position once the Golden Cross appears.
Also, both figures give more reliable signals to the trader, if they are formed on high time frames. This, in turn, suggests using medium- and long-term strategies in trading.
On longer time frames, starting from a daily one, both patterns indicate more global and extensive market changes, which last for several months and sometimes years.
The Death Cross, as well as the Golden Cross, tends to lag. That is why it is recommended to confirm their signals by means of other indicators. The most commonly used indicators for this purpose are volume, MACD, or RSI. We will talk about them a bit later.
Signals that confirm the pattern
Few traders risk opening a position on the signal from the Death Cross pattern alone. The trading strategies of experienced users, as a rule, include additional tools to filter and confirm the signals of the pattern.
1. One of the most common ways to check the signals is to add the volume indicators to the chart. Here everything is simple: if the trading volume increases along with the appearance of the pattern, it is a good confirmation of the signal reliability.
2. Another way to confirm the signals is to use the MACD indicator for this purpose. This indicator consists of two lines and a histogram.
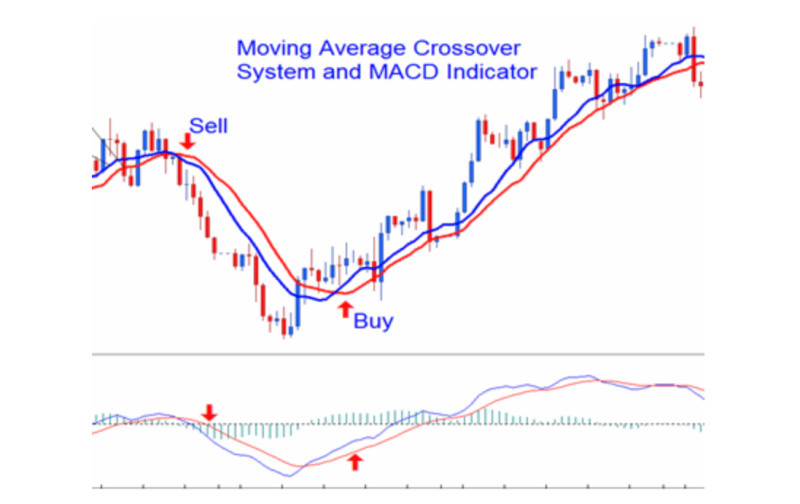
If the Death Cross is formed on the chart and the MACD is in the negative zone, that is, the histogram falls below zero, and a sell signal is correct.
3. You can also use the Stochastic, an oscillator designed to determine the price impulse and filter the moving average crossing signals. This indicator is drawn in a separate window and has two lines and a scale from 0 to 100.
Confirmation of the opening of a short position will be the exit of the Stochastic line from the overbought zone, i.e. above 80 (in the standard settings) or 70 (can be set individually for more signals).
4. A convenient option for receiving notifications is the use of automated programs that monitor the charts and signal the appearance of a potential point to enter the trade.
Special indicators with notifications were developed for this purpose. They draw arrows on the chart at the points of MA crossing and give an audible signal. As a rule, red arrows highlight entry points into short positions, and blue ones - into long positions.
Death Cross and cryptocurrencies
After reading all of the above, you can see that the Death Cross pattern is not perfect. Cryptocurrency trading using this pattern is ambiguous. Let's consider this issue in more detail on the example of Bitcoin.
The fact is that the pattern appeared on the BCT chart about 8 or 9 times in the history of its existence. The Death Cross appears on the chart of the most famous cryptocurrency about once a year since 2014.
In half of these cases, the signal turned out to be false, and after its formation, bitcoin did not become cheaper, but on the contrary, rose. Accordingly, traders who followed this signal repeatedly suffered losses.
Thus, the first time the pattern was seen on the BTC chart was in 2014. However, instead of falling, the value of the cryptocurrency was rising. Later, the Golden Cross pattern formed on the chart but its signal also turned out to be false. The value of Bitcoin decreased instead of rising.
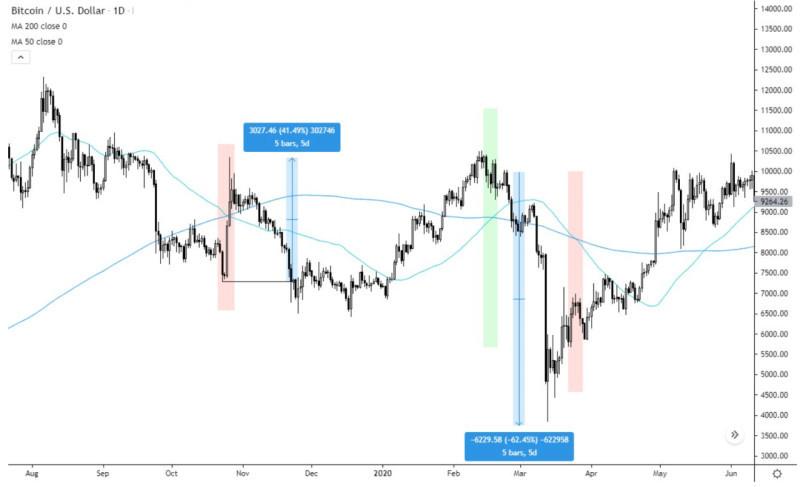
Later, the Death Cross appeared at the moment when the downtrend in the market ended and Bitcoin gained 40-50%. In contrast, the formation of the Golden Cross indicated a 40-60% drop.
Apparently, this is due to the fact that cryptocurrencies are highly volatile assets. Accordingly, moving averages are not very good at smoothing out these fluctuations.
The consolidation period could be another reason for that. We already know that the Death Cross and Golden Cross patterns do not work during periods of a sideways movement.
Nevertheless, it should be noted that the BTC value has fallen significantly in recent times by more than 50%. The asset dropped from $64 thousand to $28 thousand. However, later, it managed to slightly recover and rose above $30 thousand. However, experts believe that a return to the mark above $50 thousand is unlikely.
Death Cross and gold
In theory, the pattern seems simple. What about applying it to the charts of real assets? Does it really work? Let's find out this using the gold chart as an example.
Firstly, we should determine what factors can affect the change in the price of gold. There are many of them, but experts identify five key factors:
1. Inflation: The correlation between the growth of consumer prices and the value of gold is relative. However, there are two types of inflation. If prices rise in a period of growth and general optimism, gold becomes a less attractive investment and loses value. If, on the other hand, high inflation rates are accompanied by a fall in confidence, an increase in the value of gold should be expected;

2. Changes in the exchange rate of the US dollar and other currencies. Gold is a reserve market instrument, just like the US dollar and some other currencies. There is an inverse relation between the two: when the dollar strengthens, gold becomes less attractive, and its value declines. Conversely, when the dollar weakens, gold begins to rise;
3. Geopolitical factors such as instability, the threat of war, or war have a negative effect on investors' sentiment. In such situations, gold looks like the most attractive and safest way to invest money;
4. Interest rates and yields on government bonds. An inverse correlation is observed here: the lower rates are, the higher the price of gold is. At the same time, when there is an increase in bond yields, gold prices fall;
5. Demand and supply. Large central banks and the IMF have a significant influence on the price of gold, but it is difficult for private investors to predict their actions. The value of gold increases thanks to the higher demand from larger countries.
So how and why does the Death of Cross appear on the gold chart? Analysts say that the recent decline in the value of gold is caused by several major factors.
They are tightening of monetary policy by the Federal Reserve which leads to an increase in interest rates, the strengthening of the US dollar, and a general decline in the value of commodities.
Advantages and disadvantages
Like any other method of market analysis, the Death Cross pattern has its own advantages and disadvantages. The main advantages of trading using this pattern are the following:
- Ease of use. The indicator is fairly easy to use. Even beginners may use it in their strategies, having the most basic ideas about market analysis;
- Universality. This pattern can be used on charts of different assets with different time frames. However, it is necessary to remember that more reliable signals can be received on longer time frames;
- Availability. Moving averages are available as a standard set of every modern trading platform. Moreover, all calculations are made automatically and almost instantly.
At the same time, this model has some disadvantages:
- Lagging. This feature is typical for all trend indicators, and moving averages are no exception. That is why experienced traders use them not as a prognostic tool, but as a confirmation of the current situation in the market;
-False signals. We have already mentioned that false signals may appear in cases where there is a sideways movement on the chart or a too short time frame. In addition, you can always use additional tools to confirm the signals.
What other crosses can be found on the charts?
In addition to technical indicators, it is possible to use other methods of market analysis. For example, some traders believe that the price chart contains all the necessary information and no additional tools are required.
Candlestick analysis is one of the oldest methods of market analysis. It suggests presenting the chart in the form of Japanese candles and searching for combinations that may confirm the continuation of the current trend or its potential reversal.
Sometimes, even one candle of a certain type is enough to get a signal. A harami cross is one of the reversal combinations.
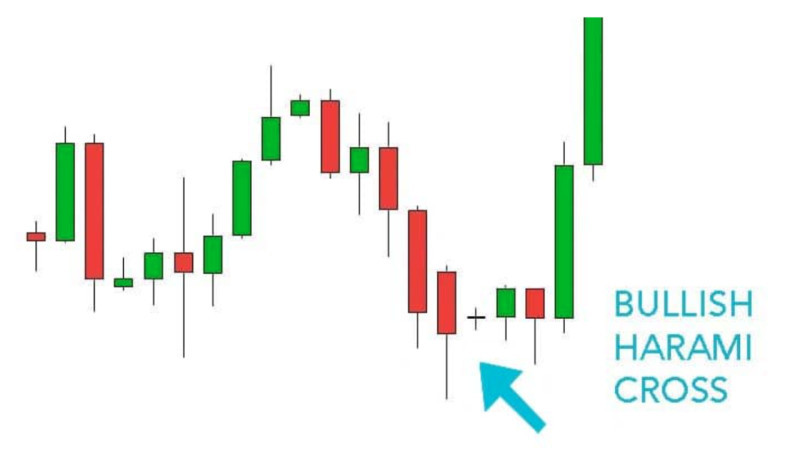
This pattern consists of two candles: one with a large body and one or two short shadows, and the other with a small or completely absent body and long shadows (Doji candle).
The combination is formed when the first large candle absorbs a small Doji candle. Notably, the second candle must be placed inside the previous one completely, together with its shadows.
The Harami Cross pattern differs from the Harami combination. In the first case, the pattern contains a Doji candle, and in the second, it has just a normal candle with a small body. At the same time, the cross is considered a stronger pattern.
In order to determine which way the reversal will occur, it is necessary to determine whether the candle with a large body is bullish or bearish.
If a large candle is green (white), it points to a reversal from a downtrend to an uptrend. If, on the contrary, the larger candle is red (black), it means that the change from a rising trend to a falling trend is expected.
To confirm the signal, it is necessary to wait for the formation of the next candle after the Doji. In the case of a bullish Harami cross, it should be green, and in the case of a bearish one, it is red.
Conclusion
In this article, we discussed the formation of the Death Cross pattern on the charts and how to use it in trading. The signals of the pattern are not always accurate.
The main reason for such inaccuracy is the lag of moving averages. Therefore, to confirm signals, it is recommended to use additional indicators.
Nevertheless, it should be understood that the main function of MAs is not to predict the future situation but to show the current one. Moving averages are good for determining the prevailing market trend.
Therefore, when we say that the Death Cross is a reversal pattern, we rather mean that the reversal has already occurred. The pattern confirms the fact of a trend change from an upward to a downward one.
That said, no pattern can predict how long a new trend will last. That is why it is so important to correctly identify entry points and set protective orders.
You may also like:
Standard deviation trading strategy


