

signal strength 2 of 5
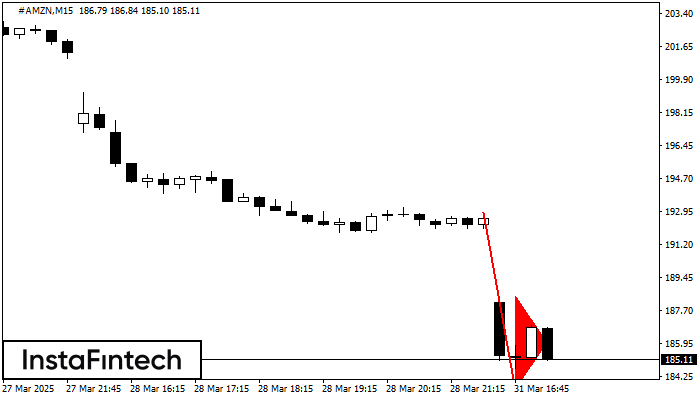
The Bearish pennant pattern has formed on the #AMZN M15 chart. The pattern signals continuation of the downtrend in case the pennant’s low of 183.52 is broken through. Recommendations: Place the sell stop pending order 10 pips below the pattern’s low. Place the take profit order at the projection distance of the flagpole height.
The M5 and M15 time frames may have more false entry points.
- All
- Double Top
- Flag
- Head and Shoulders
- Pennant
- Rectangle
- Triangle
- Triple top
- All
- #AAPL
- #AMZN
- #Bitcoin
- #EBAY
- #FB
- #GOOG
- #INTC
- #KO
- #MA
- #MCD
- #MSFT
- #NTDOY
- #PEP
- #TSLA
- #TWTR
- AUDCAD
- AUDCHF
- AUDJPY
- AUDUSD
- EURCAD
- EURCHF
- EURGBP
- EURJPY
- EURNZD
- EURRUB
- EURUSD
- GBPAUD
- GBPCHF
- GBPJPY
- GBPUSD
- GOLD
- NZDCAD
- NZDCHF
- NZDJPY
- NZDUSD
- SILVER
- USDCAD
- USDCHF
- USDJPY
- USDRUB
- All
- M5
- M15
- M30
- H1
- D1
- All
- Buy
- Sale
- All
- 1
- 2
- 3
- 4
- 5
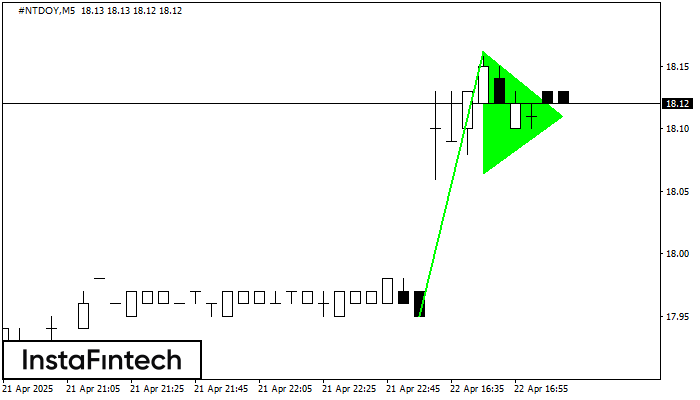
The Bullish pennant signal – Trading instrument #NTDOY M5, continuation pattern. Forecast: it is possible to set up a buy position above the pattern’s high of 18.16, with the prospect
The M5 and M15 time frames may have more false entry points.
Open chart in a new window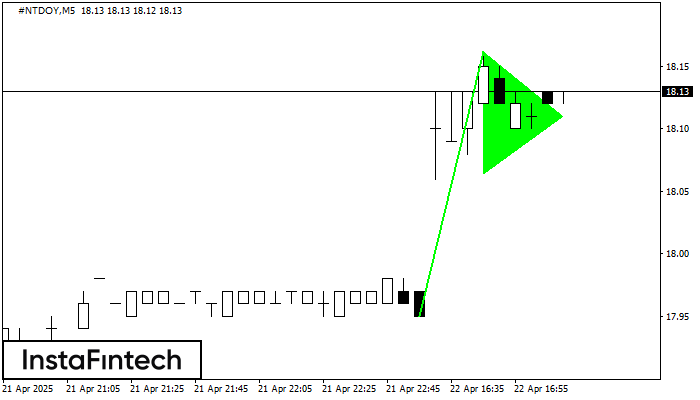
The Bullish pennant signal – Trading instrument #NTDOY M5, continuation pattern. Forecast: it is possible to set up a buy position above the pattern’s high of 18.16, with the prospect
The M5 and M15 time frames may have more false entry points.
Open chart in a new window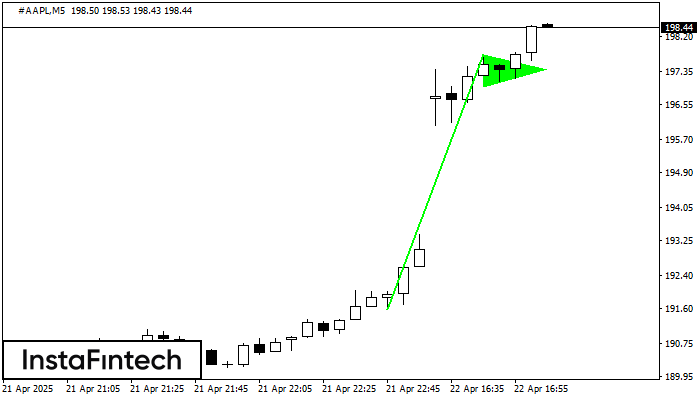
The Bullish pennant signal – Trading instrument #AAPL M5, continuation pattern. Forecast: it is possible to set up a buy position above the pattern’s high of 197.78, with the prospect
The M5 and M15 time frames may have more false entry points.
Open chart in a new window


