

signal strength 2 of 5

The Triple Top pattern has formed on the chart of the GOLD M15. Features of the pattern: borders have an ascending angle; the lower line of the pattern has the coordinates 3111.43/3112.94 with the upper limit 3127.49/3126.34; the projection of the width is 1606 points. The formation of the Triple Top figure most likely indicates a change in the trend from upward to downward. This means that in the event of a breakdown of the support level of 3111.43, the price is most likely to continue the downward movement.
The M5 and M15 time frames may have more false entry points.
- All
- Double Top
- Flag
- Head and Shoulders
- Pennant
- Rectangle
- Triangle
- Triple top
- All
- #AAPL
- #AMZN
- #Bitcoin
- #EBAY
- #FB
- #GOOG
- #INTC
- #KO
- #MA
- #MCD
- #MSFT
- #NTDOY
- #PEP
- #TSLA
- #TWTR
- AUDCAD
- AUDCHF
- AUDJPY
- AUDUSD
- EURCAD
- EURCHF
- EURGBP
- EURJPY
- EURNZD
- EURRUB
- EURUSD
- GBPAUD
- GBPCHF
- GBPJPY
- GBPUSD
- GOLD
- NZDCAD
- NZDCHF
- NZDJPY
- NZDUSD
- SILVER
- USDCAD
- USDCHF
- USDJPY
- USDRUB
- All
- M5
- M15
- M30
- H1
- D1
- All
- Buy
- Sale
- All
- 1
- 2
- 3
- 4
- 5
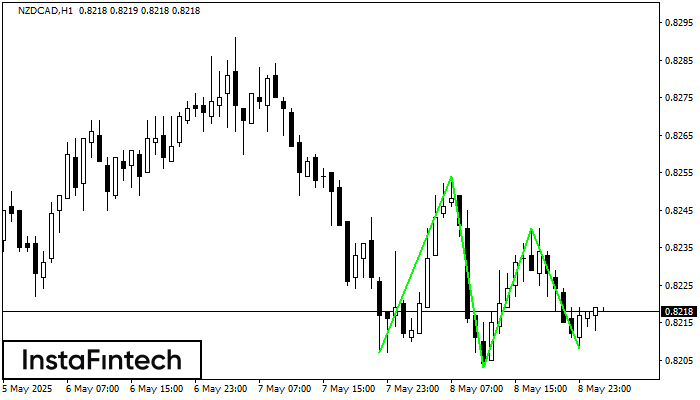
ट्रिपल बॉटम पैटर्न NZDCAD H1 के चार्ट पर बना है। पैटर्न की विशेषताएं: पैटर्न की निचली रेखा 0.8254 पर है जिसकी ऊपरी सीमा 0.8254/0.8240 है, प्रक्षेपण की चौड़ाई 47 पॉइंट्स
Open chart in a new window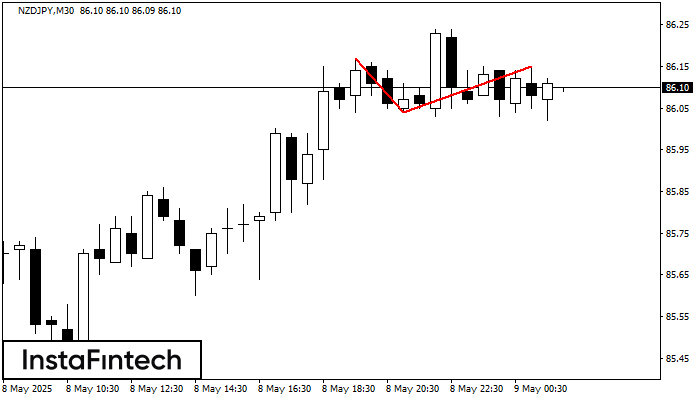
NZDJPY M30 पर डबल टॉप रीवर्सल पैटर्न बना है। विशेषताएं: ऊपरी सीमा 86.17; निचली सीमा 86.04; पैटर्न की चौड़ाई 11 पॉइंट्स है। सेल ट्रेडों को 86.04 की निचली सीमा के
Open chart in a new window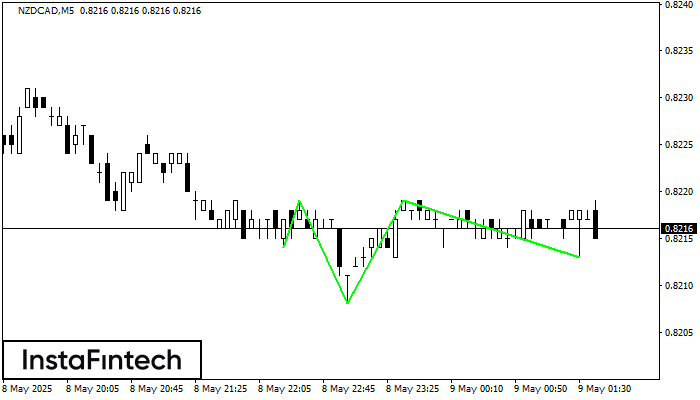
M5 के चार्ट के अनुसार, NZDCAD से इन्वर्स हेड एण्ड शोल्डर्स पैटर्न बना। हेड का टॉप 0.8219 पर सेट है जबकि नेक की मध्य रेखा 0.8208/0.8213 पर स्थित है। इन्वर्स
M5 और M15 समय सीमा में अधिक फाल्स एंट्री पॉइंट्स हो सकते हैं।
Open chart in a new window


