

signal strength 3 of 5
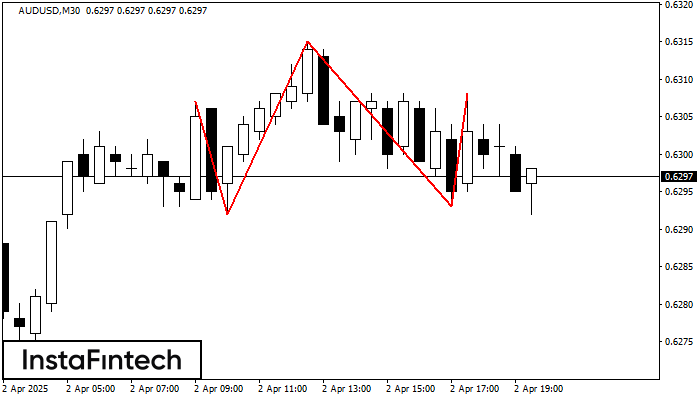
The AUDUSD M30 formed the Head and Shoulders pattern with the following features: The Head’s top is at 0.6315, the Neckline and the upward angle are at 0.6292/0.6293. The formation of this pattern can bring about changes in the current trend from bullish to bearish. In case the pattern triggers the expected changes, the price of AUDUSD will go towards 0.6263.
See Also
- All
- Double Top
- Flag
- Head and Shoulders
- Pennant
- Rectangle
- Triangle
- Triple top
- All
- #AAPL
- #AMZN
- #Bitcoin
- #EBAY
- #FB
- #GOOG
- #INTC
- #KO
- #MA
- #MCD
- #MSFT
- #NTDOY
- #PEP
- #TSLA
- #TWTR
- AUDCAD
- AUDCHF
- AUDJPY
- AUDUSD
- EURCAD
- EURCHF
- EURGBP
- EURJPY
- EURNZD
- EURRUB
- EURUSD
- GBPAUD
- GBPCHF
- GBPJPY
- GBPUSD
- GOLD
- NZDCAD
- NZDCHF
- NZDJPY
- NZDUSD
- SILVER
- USDCAD
- USDCHF
- USDJPY
- USDRUB
- All
- M5
- M15
- M30
- H1
- D1
- All
- Buy
- Sale
- All
- 1
- 2
- 3
- 4
- 5
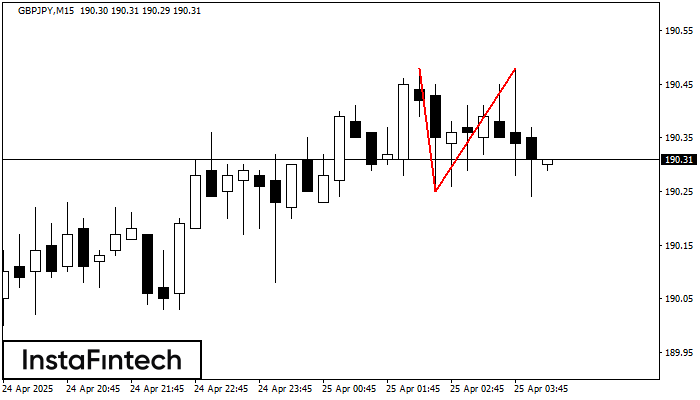
The Double Top reversal pattern has been formed on GBPJPY M15. Characteristics: the upper boundary 190.48; the lower boundary 190.25; the width of the pattern is 23 points. Sell trades
The M5 and M15 time frames may have more false entry points.
Открыть график инструмента в новом окне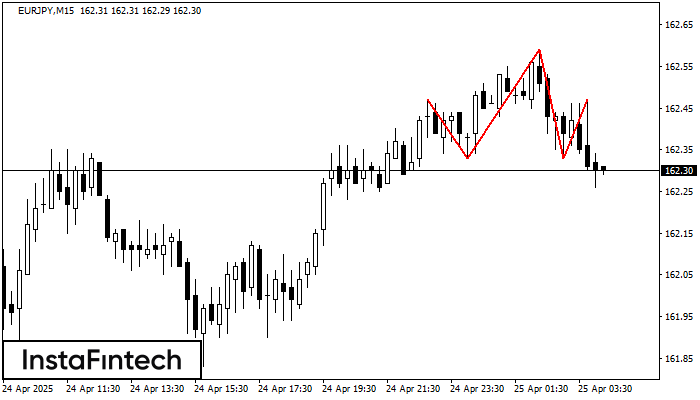
According to the chart of M15, EURJPY formed the Head and Shoulders pattern. The Head’s top is set at 162.59 while the median line of the Neck is found
The M5 and M15 time frames may have more false entry points.
Открыть график инструмента в новом окне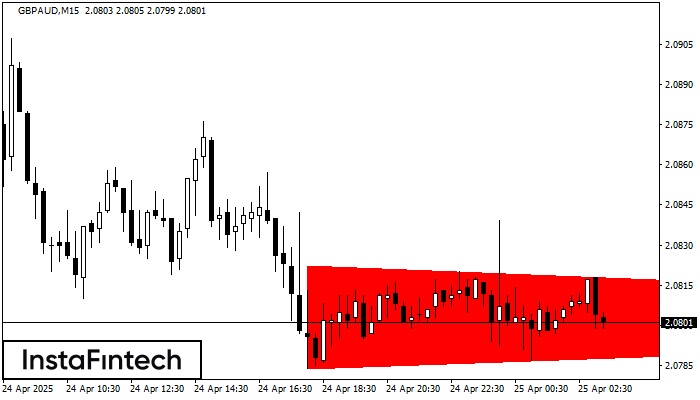
According to the chart of M15, GBPAUD formed the Bearish Symmetrical Triangle pattern. Description: The lower border is 2.0784/2.0802 and upper border is 2.0822/2.0802. The pattern width is measured
The M5 and M15 time frames may have more false entry points.
Открыть график инструмента в новом окне


