

signal strength 1 of 5

According to the chart of M5, GBPAUD formed the Head and Shoulders pattern. The Head’s top is set at 2.0644 while the median line of the Neck is found at 2.0617/2.0613. The formation of the Head and Shoulders pattern evidently signals a reversal of the upward trend. In other words, in case the scenario comes true, the price of GBPAUD will go towards 2.0598.
The M5 and M15 time frames may have more false entry points.
- All
- Double Top
- Flag
- Head and Shoulders
- Pennant
- Rectangle
- Triangle
- Triple top
- All
- #AAPL
- #AMZN
- #Bitcoin
- #EBAY
- #FB
- #GOOG
- #INTC
- #KO
- #MA
- #MCD
- #MSFT
- #NTDOY
- #PEP
- #TSLA
- #TWTR
- AUDCAD
- AUDCHF
- AUDJPY
- AUDUSD
- EURCAD
- EURCHF
- EURGBP
- EURJPY
- EURNZD
- EURRUB
- EURUSD
- GBPAUD
- GBPCHF
- GBPJPY
- GBPUSD
- GOLD
- NZDCAD
- NZDCHF
- NZDJPY
- NZDUSD
- SILVER
- USDCAD
- USDCHF
- USDJPY
- USDRUB
- All
- M5
- M15
- M30
- H1
- D1
- All
- Buy
- Sale
- All
- 1
- 2
- 3
- 4
- 5
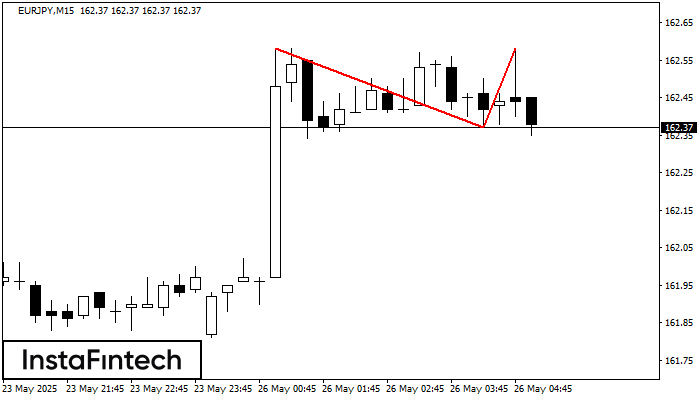
On the chart of EURJPY M15 the Double Top reversal pattern has been formed. Characteristics: the upper boundary 162.58; the lower boundary 162.37; the width of the pattern 21 points
The M5 and M15 time frames may have more false entry points.
Open chart in a new window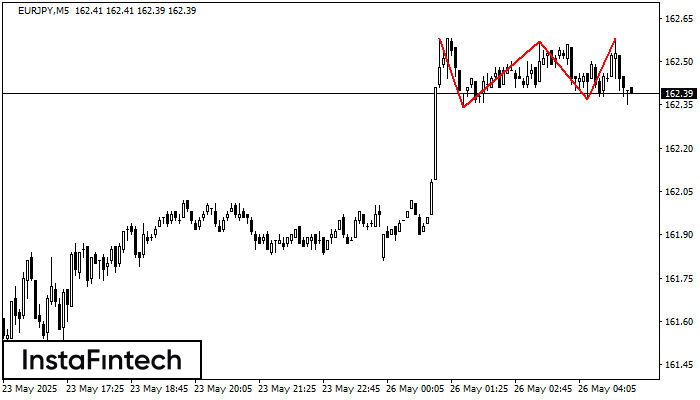
On the chart of the EURJPY M5 trading instrument, the Triple Top pattern that signals a trend change has formed. It is possible that after formation of the third peak
The M5 and M15 time frames may have more false entry points.
Open chart in a new window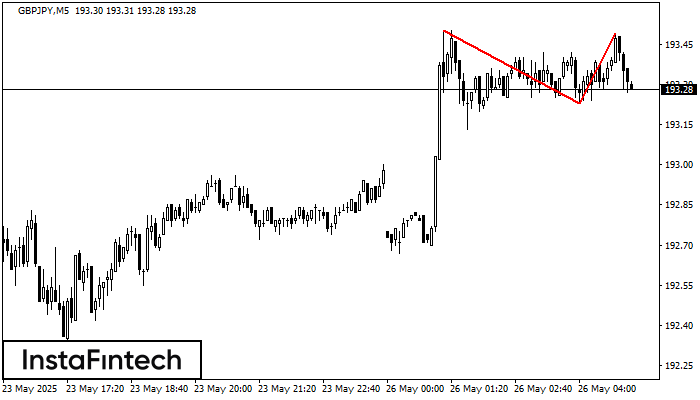
On the chart of GBPJPY M5 the Double Top reversal pattern has been formed. Characteristics: the upper boundary 193.49; the lower boundary 193.23; the width of the pattern 26 points
The M5 and M15 time frames may have more false entry points.
Open chart in a new window


