

signal strength 1 of 5
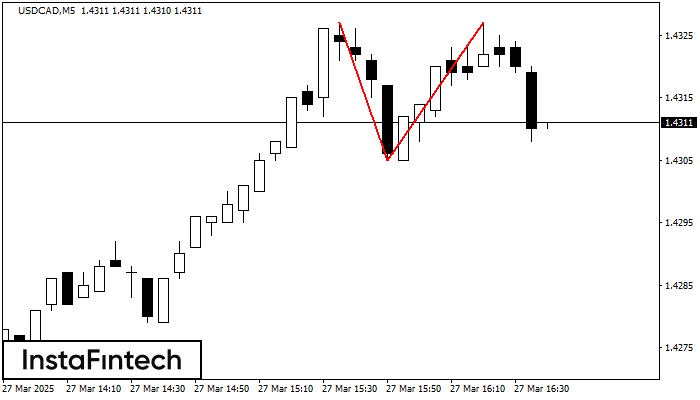
On the chart of USDCAD M5 the Double Top reversal pattern has been formed. Characteristics: the upper boundary 1.4327; the lower boundary 1.4305; the width of the pattern 22 points. The signal: a break of the lower boundary will cause continuation of the downward trend targeting the 1.4290 level.
The M5 and M15 time frames may have more false entry points.
See Also
- All
- Double Top
- Flag
- Head and Shoulders
- Pennant
- Rectangle
- Triangle
- Triple top
- All
- #AAPL
- #AMZN
- #Bitcoin
- #EBAY
- #FB
- #GOOG
- #INTC
- #KO
- #MA
- #MCD
- #MSFT
- #NTDOY
- #PEP
- #TSLA
- #TWTR
- AUDCAD
- AUDCHF
- AUDJPY
- AUDUSD
- EURCAD
- EURCHF
- EURGBP
- EURJPY
- EURNZD
- EURRUB
- EURUSD
- GBPAUD
- GBPCHF
- GBPJPY
- GBPUSD
- GOLD
- NZDCAD
- NZDCHF
- NZDJPY
- NZDUSD
- SILVER
- USDCAD
- USDCHF
- USDJPY
- USDRUB
- All
- M5
- M15
- M30
- H1
- D1
- All
- Buy
- Sale
- All
- 1
- 2
- 3
- 4
- 5
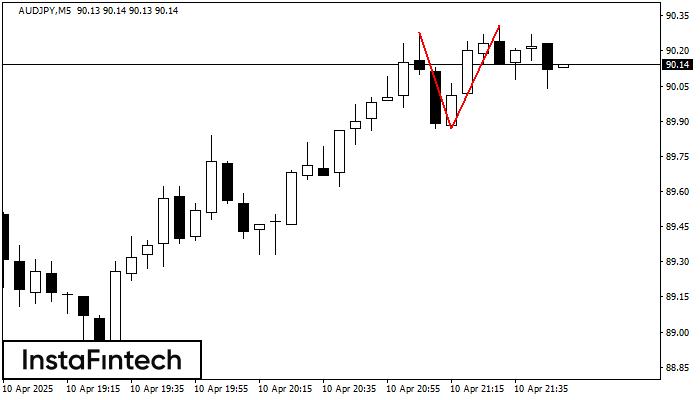
The Double Top reversal pattern has been formed on AUDJPY M5. Characteristics: the upper boundary 90.28; the lower boundary 89.87; the width of the pattern is 44 points. Sell trades
The M5 and M15 time frames may have more false entry points.
Open chart in a new window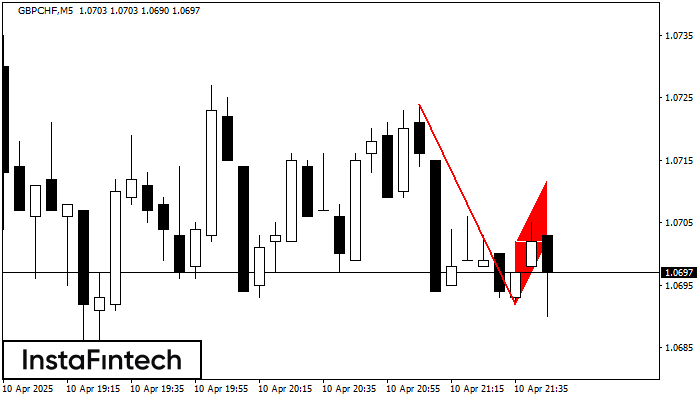
The Bearish Flag pattern has been formed on the chart GBPCHF M5. Therefore, the downwards trend is likely to continue in the nearest term. As soon as the price breaks
The M5 and M15 time frames may have more false entry points.
Open chart in a new window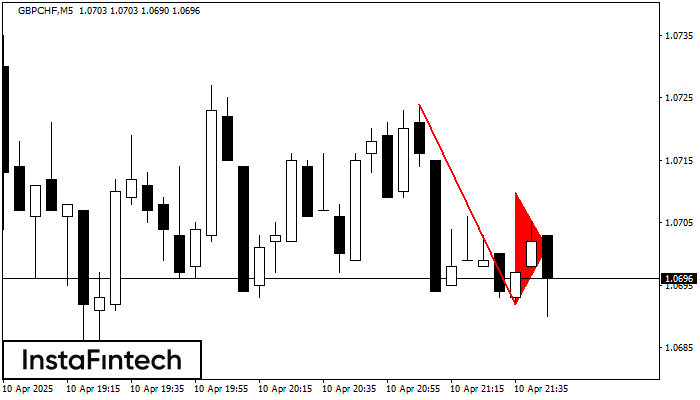
The Bearish pennant pattern has formed on the GBPCHF M5 chart. It signals potential continuation of the existing trend. Specifications: the pattern’s bottom has the coordinate of 1.0692; the projection
The M5 and M15 time frames may have more false entry points.
Open chart in a new window


