

signal strength 1 of 5

The Triple Bottom pattern has been formed on EURUSD M5. It has the following characteristics: resistance level 1.0936/1.0923; support level 1.0906/1.0904; the width is 30 points. In the event of a breakdown of the resistance level of 1.0936, the price is likely to continue an upward movement at least to 1.0916.
The M5 and M15 time frames may have more false entry points.
See Also
- All
- Double Top
- Flag
- Head and Shoulders
- Pennant
- Rectangle
- Triangle
- Triple top
- All
- #AAPL
- #AMZN
- #Bitcoin
- #EBAY
- #FB
- #GOOG
- #INTC
- #KO
- #MA
- #MCD
- #MSFT
- #NTDOY
- #PEP
- #TSLA
- #TWTR
- AUDCAD
- AUDCHF
- AUDJPY
- AUDUSD
- EURCAD
- EURCHF
- EURGBP
- EURJPY
- EURNZD
- EURRUB
- EURUSD
- GBPAUD
- GBPCHF
- GBPJPY
- GBPUSD
- GOLD
- NZDCAD
- NZDCHF
- NZDJPY
- NZDUSD
- SILVER
- USDCAD
- USDCHF
- USDJPY
- USDRUB
- All
- M5
- M15
- M30
- H1
- D1
- All
- Buy
- Sale
- All
- 1
- 2
- 3
- 4
- 5
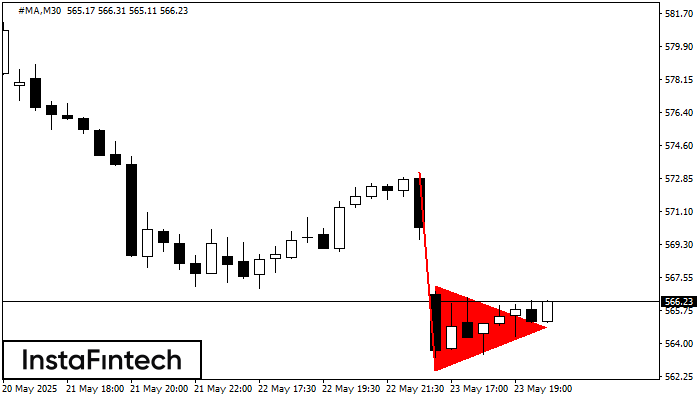
The Bearish pennant pattern has formed on the #MA M30 chart. This pattern type is characterized by a slight slowdown after which the price will move in the direction
Open chart in a new window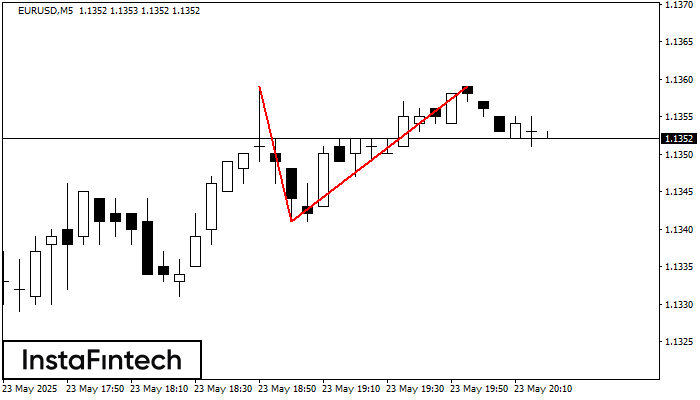
The Double Top reversal pattern has been formed on EURUSD M5. Characteristics: the upper boundary 1.1359; the lower boundary 1.1341; the width of the pattern is 18 points. Sell trades
The M5 and M15 time frames may have more false entry points.
Open chart in a new window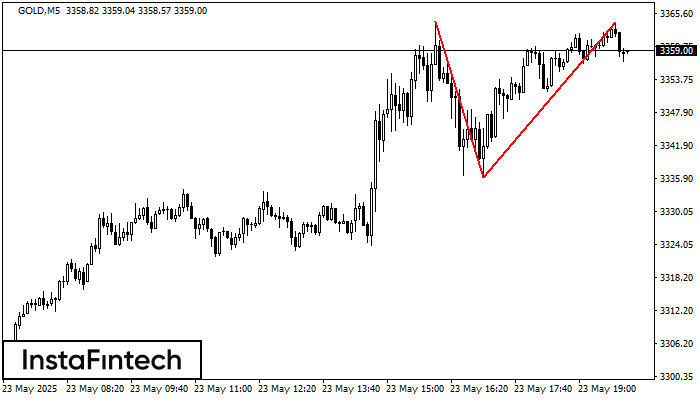
On the chart of GOLD M5 the Double Top reversal pattern has been formed. Characteristics: the upper boundary 3364.14; the lower boundary 3336.09; the width of the pattern 2805 points
The M5 and M15 time frames may have more false entry points.
Open chart in a new window


