

signal strength 2 of 5
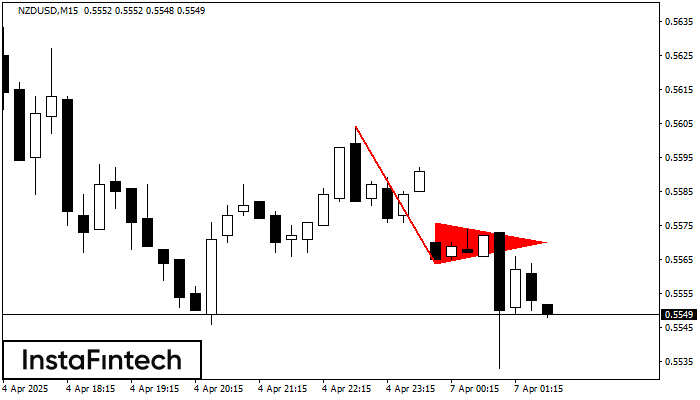
The Bearish pennant pattern has formed on the NZDUSD M15 chart. It signals potential continuation of the existing trend. Specifications: the pattern’s bottom has the coordinate of 0.5564; the projection of the flagpole height is equal to 40 pips. In case the price breaks out the pattern’s bottom of 0.5564, the downtrend is expected to continue for further level 0.5541.
The M5 and M15 time frames may have more false entry points.
See Also
- All
- Double Top
- Flag
- Head and Shoulders
- Pennant
- Rectangle
- Triangle
- Triple top
- All
- #AAPL
- #AMZN
- #Bitcoin
- #EBAY
- #FB
- #GOOG
- #INTC
- #KO
- #MA
- #MCD
- #MSFT
- #NTDOY
- #PEP
- #TSLA
- #TWTR
- AUDCAD
- AUDCHF
- AUDJPY
- AUDUSD
- EURCAD
- EURCHF
- EURGBP
- EURJPY
- EURNZD
- EURRUB
- EURUSD
- GBPAUD
- GBPCHF
- GBPJPY
- GBPUSD
- GOLD
- NZDCAD
- NZDCHF
- NZDJPY
- NZDUSD
- SILVER
- USDCAD
- USDCHF
- USDJPY
- USDRUB
- All
- M5
- M15
- M30
- H1
- D1
- All
- Buy
- Sale
- All
- 1
- 2
- 3
- 4
- 5
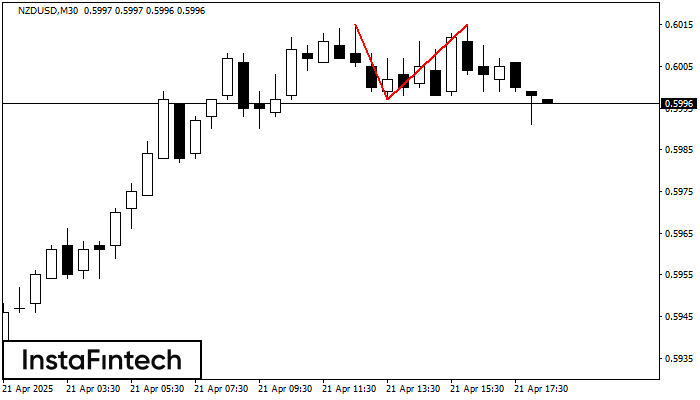
The Double Top pattern has been formed on NZDUSD M30. It signals that the trend has been changed from upwards to downwards. Probably, if the base of the pattern 0.5997
Open chart in a new window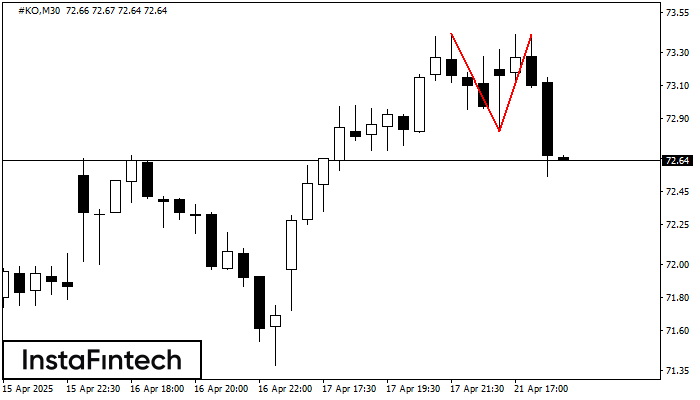
The Double Top reversal pattern has been formed on #KO M30. Characteristics: the upper boundary 73.42; the lower boundary 72.82; the width of the pattern is 59 points. Sell trades
Open chart in a new window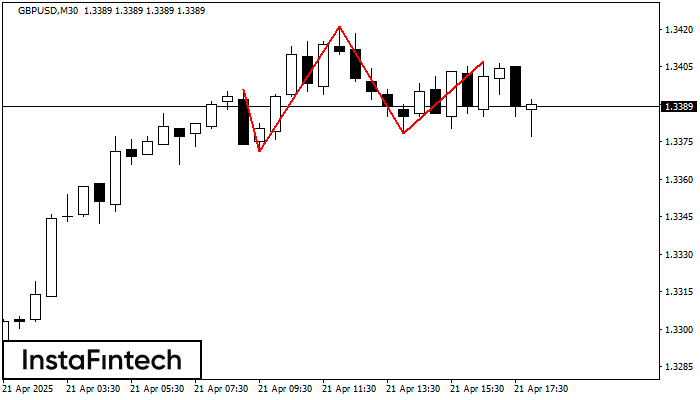
According to the chart of M30, GBPUSD formed the Head and Shoulders pattern. The Head’s top is set at 1.3421 while the median line of the Neck is found
Open chart in a new window


