empty
24.04.2025 10:15 AM
BTC/USD Analysis – April 24th: Bitcoin Shows Signs of Revival

This image is no longer relevant

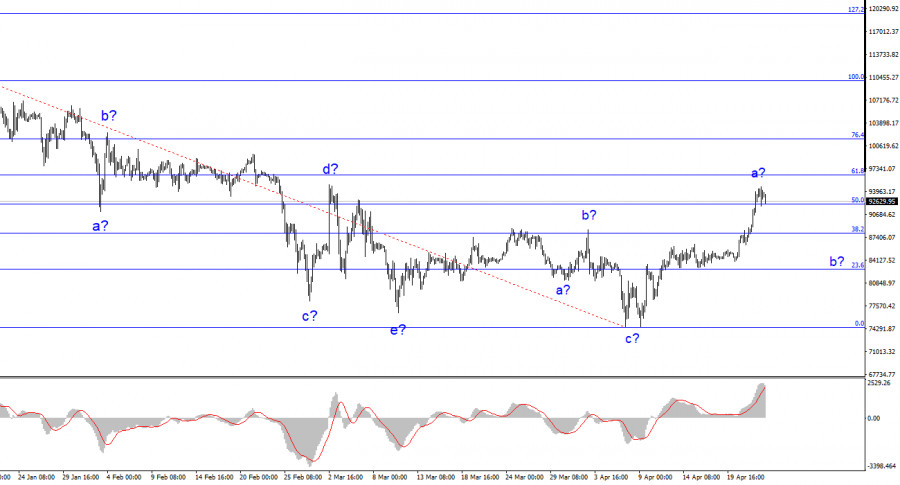
The wave pattern on the 4-hour chart for BTC/USD has become somewhat more complex. We observed a corrective downward structure that completed its formation around the $75,000 mark. Following this, a rather strong upward movement began, which could be the start of a new impulsive trend. Currently, the first wave appears to be complete, so a corrective wave 2 or b should be expected next. After that, Bitcoin's upward movement will likely resume, at least within the framework of wave c.

Bitcoin has long been supported by a steady flow of news about institutional investment, government involvement, and even pension funds. However, Trump's policies have recently driven some investors out of the market. Nonetheless, with the U.S. stock market and bond market in decline, investors may turn to Bitcoin as a hedge, as it is less influenced by Trump's decisions. Once again, Bitcoin is being viewed as a "crisis hedge," increasing the probability of renewed growth for the digital asset.

BTC/USD has surged by $19,000 in a short period, which is substantial considering the current global economic instability. The reasons for this rally are varied, but each of them can be reasonably questioned. For instance, Bitcoin began rising after reports emerged that Trump is not planning to fire Fed Chair Jerome Powell. But how exactly does Powell's job security relate to Bitcoin?

Many economists now expect the Fed to begin cutting rates. However, Powell has consistently stated that the FOMC will respond to changes in economic data, not to shifts in Trump's trade policies. Some are even anticipating a new round of quantitative easing (QE), which would inject new liquidity into the economy—similar to what we saw during the COVID-19 era. While such policies could benefit cryptocurrencies, especially Bitcoin, there is no sign of QE being launched yet. Moreover, it is highly questionable whether the Fed—after years of battling inflation—would now take steps that could reignite it.

So, much of the reasoning behind Bitcoin's rally seems speculative or, at the very least, highly debatable. Based on this, I believe we are more likely to see the formation of a corrective wave structure, rather than a new impulsive one. As I've stated in previous months, a prolonged and complex corrective phase still lies ahead.

This image is no longer relevant

Final Thoughts

Based on the analysis of BTC/USD, I conclude that the downward segment of the trend is still developing. All signs point toward a complex, multi-month correction. Therefore, I have not recommended buying Bitcoin before, and I see even less reason to do so now. In my view, the best approach remains looking for selling opportunities.

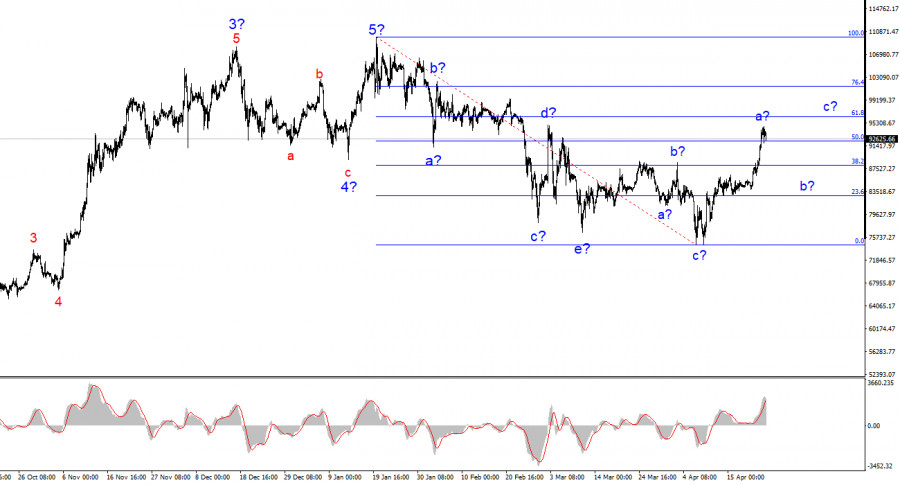
At this stage, Bitcoin appears to be forming a corrective upward sequence of waves, which has not yet completed. Once wave c concludes, I would begin to seek short positions, targeting the $75,000 level.

On the higher wave scale, we can still see a completed five-wave upward structure. What is currently unfolding looks like the beginning of a corrective, downward phase or potentially a full-blown bearish cycle.

Core Principles of My Analysis:

  1. Wave structures should be simple and clear. Complex patterns are difficult to trade and often unpredictable.
  2. If uncertainty dominates the market, it's better to stay out.
  3. There is never 100% certainty in market direction—always use Stop Loss orders.
  4. Elliott Wave analysis can be combined with other analytical methods and trading strategies.
Chin Zhao,
Analytical expert of InstaForex
© 2007-2025
Select timeframe
5
min
15
min
30
min
1
hour
4
hours
1
day
1
week
Earn on cryptocurrency rate changes with InstaForex
Download MetaTrader 4 and open your first trade
  • Grand Choice
    Contest by
    InstaForex
    InstaForex always strives to help you
    fulfill your biggest dreams.
    JOIN CONTEST

Recommended Stories

Bitcoin. May 23rd. Smart Money System Analysis

Bitcoin continues to form a bullish trend structure. One could argue whether there are real reasons for a new bullish trend at the moment, but the chart suggests only that—unambiguously

Samir Klishi 20:04 2025-05-23 UTC+2

TRUMP official: crypto community, protests, and politics

On the evening of May 22, 2025, a unique event took place at the Trump National Golf Club in Virginia — a dinner hosted by Donald Trump with the largest

Jurij Tolin 16:49 2025-05-23 UTC+2

Technical Analysis of Intraday Price Movement of Doge Cryptocurrency, Friday May 23, 2025.

It appears that the price movement of the Doge Cryptocurrency on the 4-hour chart is moving above the WMA (21) which has a slope that is going upwards

Arief Makmur 09:04 2025-05-23 UTC+2

Technical Analysis of Intraday Price Movement of Ripple Cryptocurrency, Friday May 23, 2025.

If we look at the 4-hour chart of the Ripple cryptocurrency, it appears to be moving above the WMA (21) which has a steep slope and has successfully broken

Arief Makmur 09:04 2025-05-23 UTC+2

Bitcoin Forecast for May 23, 2025

On Thursday, Bitcoin's price reached the target level of 111,770. The Marlin oscillator appears to be lagging behind the price, giving the impression of a potential divergence — though unconventional

Laurie Bailey 04:45 2025-05-23 UTC+2

Bitcoin aims to hit $120,000? What lies behind its rally and when to expect retracement

On May 22, Bitcoin confidently broke through the $111,888 level, setting a new all-time high of $111,867. Unlike previous rallies marked by retail investor euphoria, this time the market's behavior

Ekaterina Kiseleva 16:12 2025-05-22 UTC+2

Bitcoin extending confident rally

Bitcoin demand appears to be surging, judging by its recent performance. At the time of publication, the BTC/USD pair was trading near 111,200.00, slightly down from today's and the all-time

Jurij Tolin 16:02 2025-05-22 UTC+2

Bitcoin: $115,000 — Next Stop or Bull Trap?

Bitcoin is steadily approaching its all-time high and, according to several analysts, is poised to set a new record. Current levels near $105,000 are more than just numbers — they

Ekaterina Kiseleva 00:58 2025-05-21 UTC+2

BTC/USD Analysis on May 20, 2025

The wave pattern on the 4-hour chart for BTC/USD has been becoming more complex in recent months. We observed a corrective downward structure, which completed its formation around the 75,000

Chin Zhao 11:11 2025-05-20 UTC+2

Technical Analysis of Daily Price Movement of Ethereum Cryptocurrency, Friday May 16, 2025.

If we look at the 4-hour chart, the Ethereum cryptocurrency appears to be moving above the WMA (21) which is a dynamic support where the WMA has a slope that

Arief Makmur 06:09 2025-05-16 UTC+2
Can't speak right now?
Ask your question in the chat.
Widget callback
 

Dear visitor,

Your IP address shows that you are currently located in the USA. If you are a resident of the United States, you are prohibited from using the services of InstaFintech Group including online trading, online transfers, deposit/withdrawal of funds, etc.

If you think you are seeing this message by mistake and your location is not the US, kindly proceed to the website. Otherwise, you must leave the website in order to comply with government restrictions.

Why does your IP address show your location as the USA?

  • - you are using a VPN provided by a hosting company based in the United States;
  • - your IP does not have proper WHOIS records;
  • - an error occurred in the WHOIS geolocation database.

Please confirm whether you are a US resident or not by clicking the relevant button below. If you choose the wrong option, being a US resident, you will not be able to open an account with InstaForex anyway.

We are sorry for any inconvenience caused by this message.