GBP/USD 5-Minute Analysis
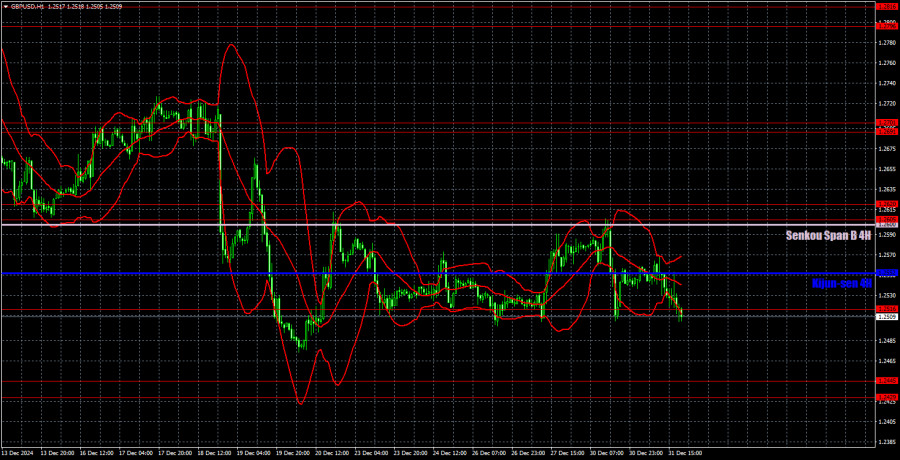
On Tuesday, the GBP/USD currency pair traded lower, and has already broken through the 1.2516 level for the sixth time, which can be considered the lower boundary of the horizontal channel. Therefore, a rebound from this level and a renewed rise toward the 1.2605–1.2620 area is entirely possible. The sideways range has not yet ended, so it is still too early to expect a resumption of the downtrend. However, there is nothing preventing the market from beginning to sell the pound at the start of the new year. We anticipate further medium-term declines in the British currency, at least until January 20, when Donald Trump will take office as President of the United States. While it is difficult to predict what specific changes will occur and when they will happen, such changes are inevitable.
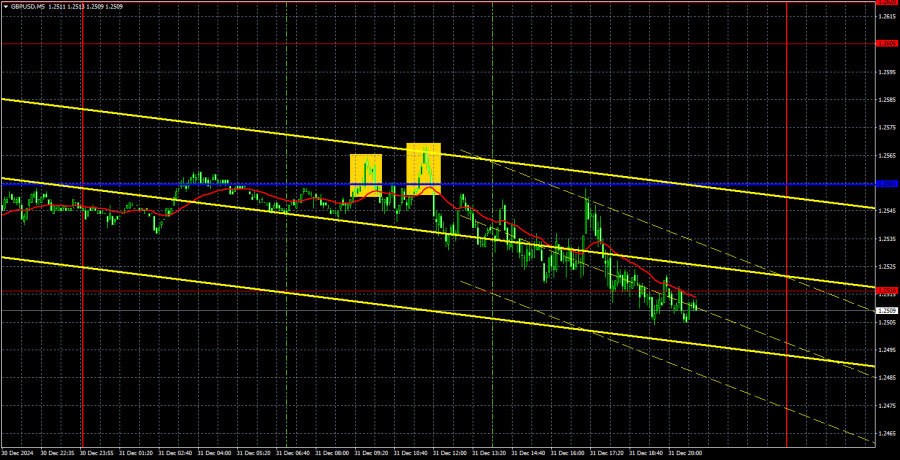
On Tuesday, several trading signals appeared on the 5-minute timeframe, all near the critical Kijun-sen line. These signals were unusually imprecise, and the day's movement was very erratic. As a result, we do not recommend trading based on these signals. It is unlikely that anyone seriously considered entering the market on December 31. Ultimately, the signals proved to be poor, making it challenging to profit from them. As the new year begins, it is crucial to assess whether the market is ready to resume the downtrend immediately.
COT Report
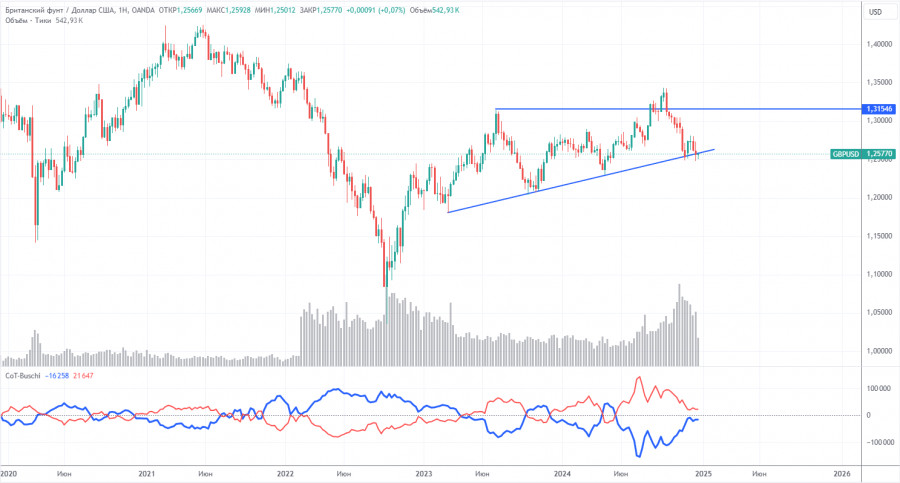
COT reports for the British pound indicate that the sentiment of commercial traders has fluctuated significantly in recent years. The red and blue lines, which represent the net positions of commercial and non-commercial traders, frequently cross and tend to hover around the zero mark. Currently, the price initially broke through the 1.3154 level but then dropped back to the trendline. We expect the price to consolidate below this trendline. The first rebound from this line (the fourth overall) was very weak, suggesting that the next attempt is likely to succeed, leading to a decline.
According to the latest COT report for the British pound, the non-commercial group closed 14,500 buy contracts and 9,000 sell contracts, resulting in a reduction of the net position of non-commercial traders by another 5,500 contracts over the week.
The fundamental backdrop does not currently provide any justification for long-term purchases of the pound sterling, and there is a realistic chance that the currency may resume its global downtrend. While the trendline is currently preventing further declines, failing to break below it could signal another wave of upward movement, potentially pushing the pound above 1.3500. However, what fundamental factors currently support such a scenario? The pound cannot continue to rise indefinitely without substantial justification.
GBP/USD 1-Hour Analysis
On the hourly timeframe, the GBP/USD pair exhibits a generally bearish outlook, although the British currency is moving within a horizontal channel. Currently, there are no significant factors that could lead to a substantial increase in the pound, aside from occasional technical corrections. Although the meetings of the Bank of England and the Federal Reserve could have negatively impacted the dollar, they ultimately put pressure on the pound instead. In the medium term, we expect further declines in the British currency.
For January 2, we highlight the following important levels: 1.2349, 1.2429–1.2445, 1.2516, 1.2605–1.2620, 1.2691–1.2701, 1.2796–1.2816, 1.2863, and 1.2981–1.2987. The Senkou Span B (1.2600) and Kijun-sen (1.2552) lines may also provide trading signals. It is advisable to set the Stop Loss at breakeven if the price moves 20 pips in the desired direction. The Ichimoku indicator lines may adjust throughout the day, which should be considered when determining trading signals.
The UK and the US are set to release second estimates of the manufacturing PMI, which we consider to be of secondary importance. Additionally, the US will publish its jobless claims report, which we also view as insignificant.
Illustration Explanations:
- Support and Resistance Levels (thick red lines): Thick red lines indicate where movement may come to an end. Please note that these lines are not sources of trading signals.
- Kijun-sen and Senkou Span B Lines: Ichimoku indicator lines transferred from the 4-hour timeframe to the hourly timeframe. These are strong lines.
- Extreme Levels (thin red lines): Thin red lines where the price has previously bounced. These serve as sources of trading signals.
- Yellow Lines: Trendlines, trend channels, or any other technical patterns.
- Indicator 1 on COT Charts: Represents the net position size for each category of traders.


