empty
09.01.2024 11:08 AM
EUR/USD and GBP/USD: Trading plan for beginner traders on January 9, 2024

Details of the Economic Calendar on January 8

Eurozone retail sales decreased by 0.3% in November compared to the previous month, matching analysts' forecasts.

In terms of the information flow, there were speeches by Federal Reserve representatives. One of them expressed the opinion about a possible increase in the refinancing rate in case of inflation growth in the USA, while another head of the Federal Reserve Bank, on the contrary, considers an early reduction of the key rate.

Analysis of Trading Charts from January 8

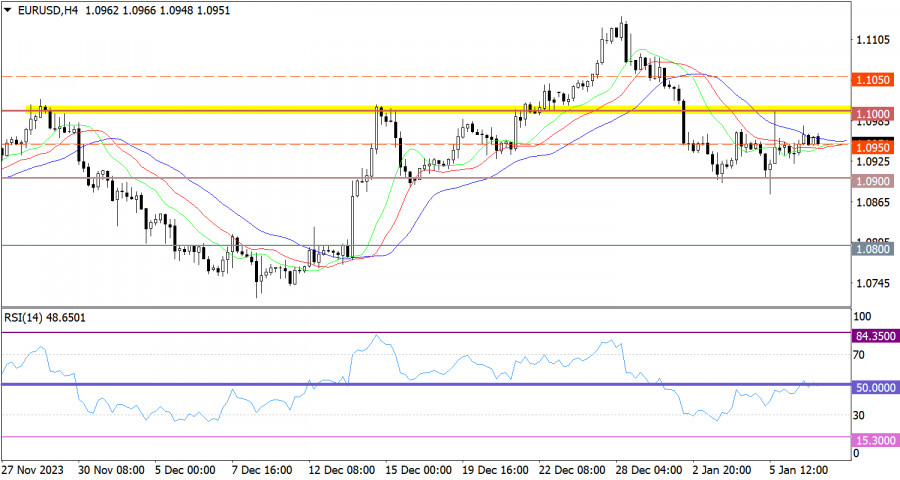
The EUR/USD currency pair has been relatively stable since last Friday, forming doji candles on the daily chart. This price action indicates a characteristic stagnation, which could lead to an accumulation of trading forces.

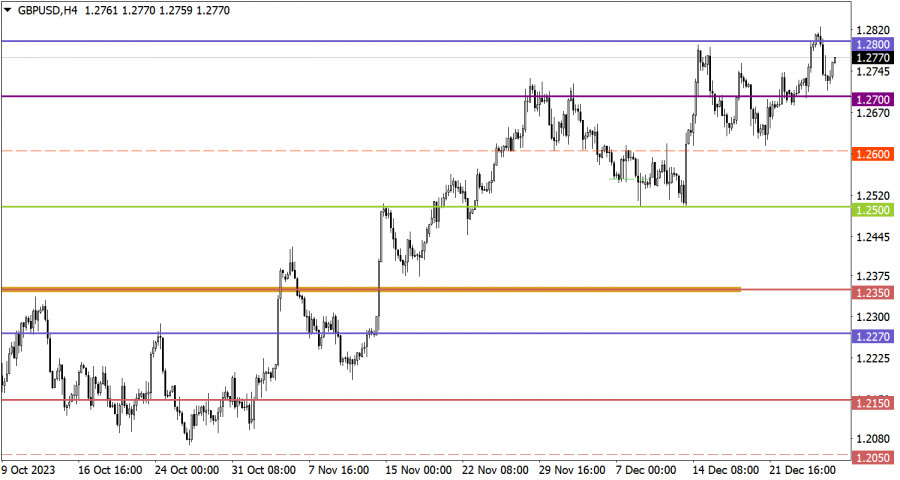
The GBP/USD currency pair shows an upward trend over several days. However, when examining the trading chart over several weeks, a characteristic flat is observed between the levels of 1.2600 and 1.2700.

This image is no longer relevant

Economic Calendar on January 9

Today, the main focus should be on the unemployment rate in the European Union, which is expected to rise from 6.5% to 6.6%. This could potentially lead to some weakening of the euro if the data matches the statistics.

EUR/USD Trading Plan for January 9

Prolonged stagnation at one level can eventually lead to speculative price jumps. For this reason, the current stagnation should be considered as a lever for subsequent price movements. The optimal approach is the method of outgoing impulse, which takes into account a local spike in activity.

This image is no longer relevant

GBP/USD Trading Plan for January 9

In this case, the upward cycle began from the lower boundary at 1.2600. It is possible that near the 1.2700 mark, there will be a reduction in the volume of long positions, which could lead to a slowdown in the upward cycle.

This image is no longer relevant

What's on the charts

The candlestick chart type is white and black graphic rectangles with lines above and below. With a detailed analysis of each individual candle, you can see its characteristics relative to a particular time frame: opening price, closing price, intraday high and low.

Horizontal levels are price coordinates, relative to which a price may stop or reverse its trajectory. In the market, these levels are called support and resistance.

Circles and rectangles are highlighted examples where the price reversed in history. This color highlighting indicates horizontal lines that may put pressure on the asset's price in the future.

The up/down arrows are landmarks of the possible price direction in the future.

Gven Podolsky,
Analytical expert of InstaForex
© 2007-2025
Select timeframe
5
min
15
min
30
min
1
hour
4
hours
1
day
1
week
Earn on cryptocurrency rate changes with InstaForex
Download MetaTrader 4 and open your first trade
  • Grand Choice
    Contest by
    InstaForex
    InstaForex always strives to help you
    fulfill your biggest dreams.
    JOIN CONTEST

Recommended Stories

How to Trade the GBP/USD Pair on March 28? Simple Tips and Trade Analysis for Beginners

Analysis of Thursday's Trades 1H Chart of GBP/USD On Thursday, the GBP/USD pair also traded higher—and quite strongly. Despite the release of a reasonably solid Q4 GDP report

Paolo Greco 06:05 2025-03-28 UTC+2

How to Trade the EUR/USD Pair on March 28? Simple Tips and Trade Analysis for Beginners

Analysis of Thursday's Trades 1H Chart of EUR/USD The EUR/USD currency pair rose to the 1.0804 level on Thursday. Naturally, such an unexpected and relatively strong rise in the euro

Paolo Greco 06:05 2025-03-28 UTC+2

Trading Recommendations and Analysis for GBP/USD on March 28: The Pound Keeps Swinging

The GBP/USD currency pair showed a powerful upward movement on Thursday. Naturally, the catalyst was once again Donald Trump, who imposed new 25% tariffs on all automobile imports

Paolo Greco 02:47 2025-03-28 UTC+2

Trading Recommendations and Analysis for EUR/USD on March 28: Trump's Tariffs and GDP

On Thursday, the EUR/USD currency pair surged sharply without breaking the prevailing downtrend of recent days. Valid reasons contributed to the dollar's decline after Donald Trump announced new tariffs

Paolo Greco 02:47 2025-03-28 UTC+2

GBP/USD: Trading Plan for the U.S. Session on March 27th (Review of Morning Trades)

In my morning forecast, I focused on the 1.2916 level and planned to make trading decisions based on it. Let's look at the 5-minute chart and see what happened

Miroslaw Bawulski 17:56 2025-03-27 UTC+2

EUR/USD: Trading Plan for the U.S. Session on March 27th (Review of Morning Trades)

In my morning forecast, I focused on the 1.0769 level and planned to make trading decisions based on it. Let's take a look at the 5-minute chart and see what

Miroslaw Bawulski 17:53 2025-03-27 UTC+2

How to Trade the GBP/USD Pair on March 27? Simple Tips and Trade Analysis for Beginners

Analysis of Wednesday's Trades 1H Chart of GBP/USD On Wednesday, the GBP/USD pair showed a downward movement that finally aligned with the macroeconomic backdrop. During the day, traders were interested

Paolo Greco 05:42 2025-03-27 UTC+2

How to Trade the EUR/USD Pair on March 27? Simple Tips and Trade Analysis for Beginners

Analysis of Wednesday's Trades 1H Chart of EUR/USD On Wednesday, the EUR/USD currency pair continued its sluggish decline. The euro's depreciation is quite logical, although traders continue to ignore

Paolo Greco 05:42 2025-03-27 UTC+2

Trading Recommendations and Analysis for GBP/USD on March 27: Pound Dropped, but Nothing Has Changed

The GBP/USD currency pair traded lower on Wednesday. We had warned that the pair has recently been swinging like a pendulum. The pound was rising on Tuesday, so it could

Paolo Greco 03:06 2025-03-27 UTC+2

Trading Recommendations and Analysis for EUR/USD on March 27: The Market Is in No Hurry

The EUR/USD currency pair traded with minimal losses throughout Wednesday, while the overall trend on the hourly time frame remains bearish following the price's exit from the ascending channel

Paolo Greco 03:06 2025-03-27 UTC+2
Can't speak right now?
Ask your question in the chat.
Widget callback
 

Dear visitor,

Your IP address shows that you are currently located in the USA. If you are a resident of the United States, you are prohibited from using the services of InstaFintech Group including online trading, online transfers, deposit/withdrawal of funds, etc.

If you think you are seeing this message by mistake and your location is not the US, kindly proceed to the website. Otherwise, you must leave the website in order to comply with government restrictions.

Why does your IP address show your location as the USA?

  • - you are using a VPN provided by a hosting company based in the United States;
  • - your IP does not have proper WHOIS records;
  • - an error occurred in the WHOIS geolocation database.

Please confirm whether you are a US resident or not by clicking the relevant button below. If you choose the wrong option, being a US resident, you will not be able to open an account with InstaForex anyway.

We are sorry for any inconvenience caused by this message.