

signal strength 1 of 5
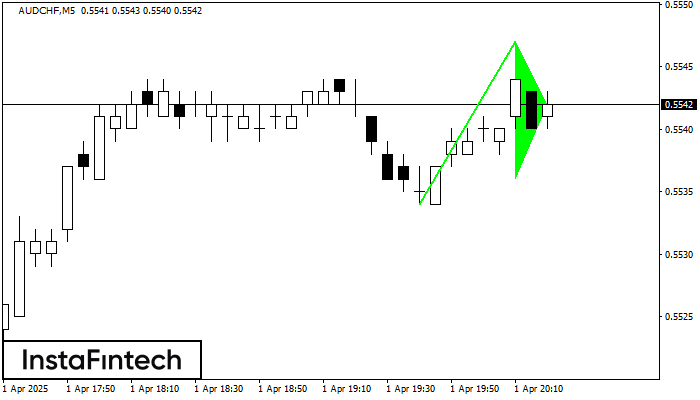
The Bullish pennant pattern is formed on the AUDCHF M5 chart. It is a type of the continuation pattern. Supposedly, in case the price is fixed above the pennant’s high of 0.5547, a further uptrend is possible.
The M5 and M15 time frames may have more false entry points.
- All
- Double Top
- Flag
- Head and Shoulders
- Pennant
- Rectangle
- Triangle
- Triple top
- All
- #AAPL
- #AMZN
- #Bitcoin
- #EBAY
- #FB
- #GOOG
- #INTC
- #KO
- #MA
- #MCD
- #MSFT
- #NTDOY
- #PEP
- #TSLA
- #TWTR
- AUDCAD
- AUDCHF
- AUDJPY
- AUDUSD
- EURCAD
- EURCHF
- EURGBP
- EURJPY
- EURNZD
- EURRUB
- EURUSD
- GBPAUD
- GBPCHF
- GBPJPY
- GBPUSD
- GOLD
- NZDCAD
- NZDCHF
- NZDJPY
- NZDUSD
- SILVER
- USDCAD
- USDCHF
- USDJPY
- USDRUB
- All
- M5
- M15
- M30
- H1
- D1
- All
- Buy
- Sale
- All
- 1
- 2
- 3
- 4
- 5
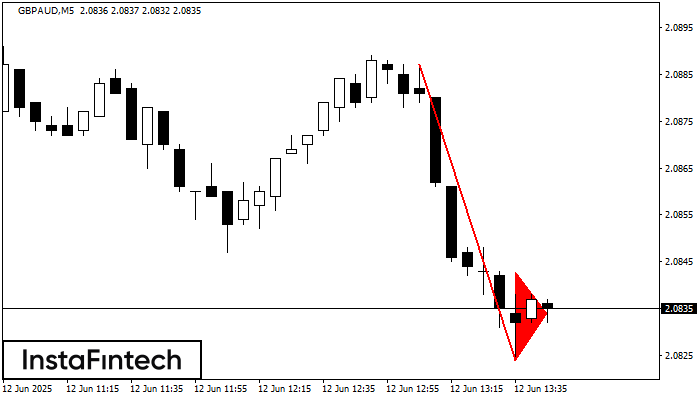
The Bearish pennant pattern has formed on the GBPAUD M5 chart. The pattern signals continuation of the downtrend in case the pennant’s low of 2.0824 is broken through. Recommendations: Place
The M5 and M15 time frames may have more false entry points.
Open chart in a new window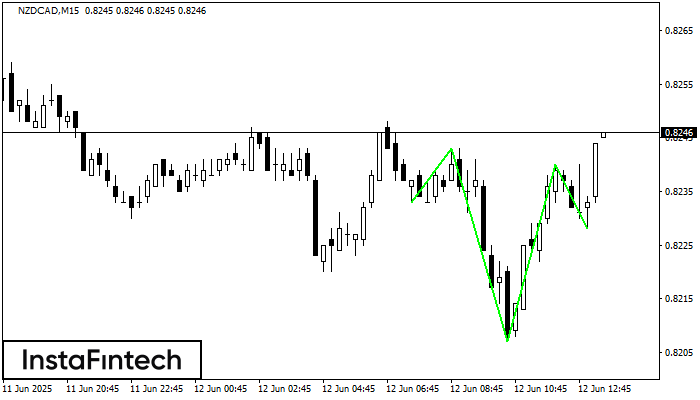
According to the chart of M15, NZDCAD produced the pattern termed the Inverse Head and Shoulder. The Head is fixed at 0.8207 while the median line of the Neck
The M5 and M15 time frames may have more false entry points.
Open chart in a new window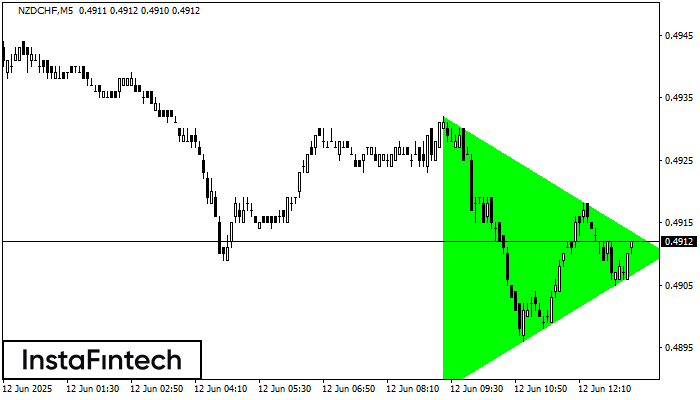
According to the chart of M5, NZDCHF formed the Bullish Symmetrical Triangle pattern, which signals the trend will continue. Description. The upper border of the pattern touches the coordinates 0.4932/0.4910
The M5 and M15 time frames may have more false entry points.
Open chart in a new window


