

signal strength 2 of 5
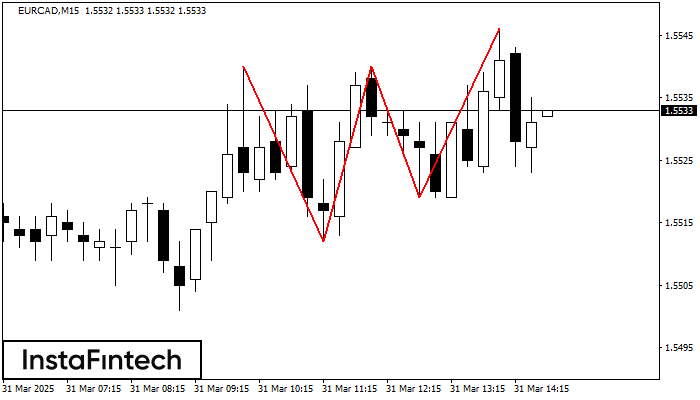
The Triple Top pattern has formed on the chart of the EURCAD M15. Features of the pattern: borders have an ascending angle; the lower line of the pattern has the coordinates 1.5512/1.5519 with the upper limit 1.5540/1.5546; the projection of the width is 28 points. The formation of the Triple Top figure most likely indicates a change in the trend from upward to downward. This means that in the event of a breakdown of the support level of 1.5512, the price is most likely to continue the downward movement.
The M5 and M15 time frames may have more false entry points.
- All
- Double Top
- Flag
- Head and Shoulders
- Pennant
- Rectangle
- Triangle
- Triple top
- All
- #AAPL
- #AMZN
- #Bitcoin
- #EBAY
- #FB
- #GOOG
- #INTC
- #KO
- #MA
- #MCD
- #MSFT
- #NTDOY
- #PEP
- #TSLA
- #TWTR
- AUDCAD
- AUDCHF
- AUDJPY
- AUDUSD
- EURCAD
- EURCHF
- EURGBP
- EURJPY
- EURNZD
- EURRUB
- EURUSD
- GBPAUD
- GBPCHF
- GBPJPY
- GBPUSD
- GOLD
- NZDCAD
- NZDCHF
- NZDJPY
- NZDUSD
- SILVER
- USDCAD
- USDCHF
- USDJPY
- USDRUB
- All
- M5
- M15
- M30
- H1
- D1
- All
- Buy
- Sale
- All
- 1
- 2
- 3
- 4
- 5

M5 চার্ট অনুযায়ী, GBPAUD বুলিশ সিমেট্রিকাল ট্রায়াঙ্গেল প্যাটার্ন গঠন করেছে। প্যাটার্নের নীচের সীমানা 2.0825/2.0852-এর কোঅর্ডিনেটগুলো স্পর্শ করেছে যেখানে উপরের সীমানাটি 2.0880/2.0852 জুড়ে যাচ্ছে৷ যদি বুলিশ সিমেট্রিকাল ট্রায়াঙ্গেল প্যাটার্নটি বজায় থাকে
M5 এবং M15 টাইম ফ্রেমে আরও ভুল এন্ট্রি পয়েন্ট থাকতে পারে।
Open chart in a new window
M5 চার্ট অনুযায়ী, AUDCAD বুলিশ সিমেট্রিকাল ট্রায়াঙ্গেল প্যাটার্ন গঠন করেছে। বর্ণনা: এটি একটি ধারাবাহিক প্রবণতার প্যাটার্ন। 0.8879 এবং 0.8869 হল যথাক্রমে উপরের এবং নীচের সীমানার কোঅর্ডিনেট। চার্টে প্যাটার্নের প্রস্থ
M5 এবং M15 টাইম ফ্রেমে আরও ভুল এন্ট্রি পয়েন্ট থাকতে পারে।
Open chart in a new window
M30 চার্ট অনুযায়ী, USDJPY বিয়ারিশ সিমেট্রিক্যাল ট্রায়াঙ্গেল প্যাটার্ন গঠন করেছে। 140.49 -এর নীচের সীমানা লঙ্ঘন করা হলে এই প্যাটার্নটি আরও নিম্নমুখী প্রবণতার সংকেত প্রদান করে। এখানে, সম্ভাব্য মুনাফা উপলব্ধ প্যাটার্নের
Open chart in a new window


