empty
30.03.2023 03:40 PM
Trading Signal for GOLD (XAU/USD) for March 30 - 31, 2023: buy above $1,963 or sell if breaks $1,955 (21 SMA - 61.8% Fibonacci)

This image is no longer relevant

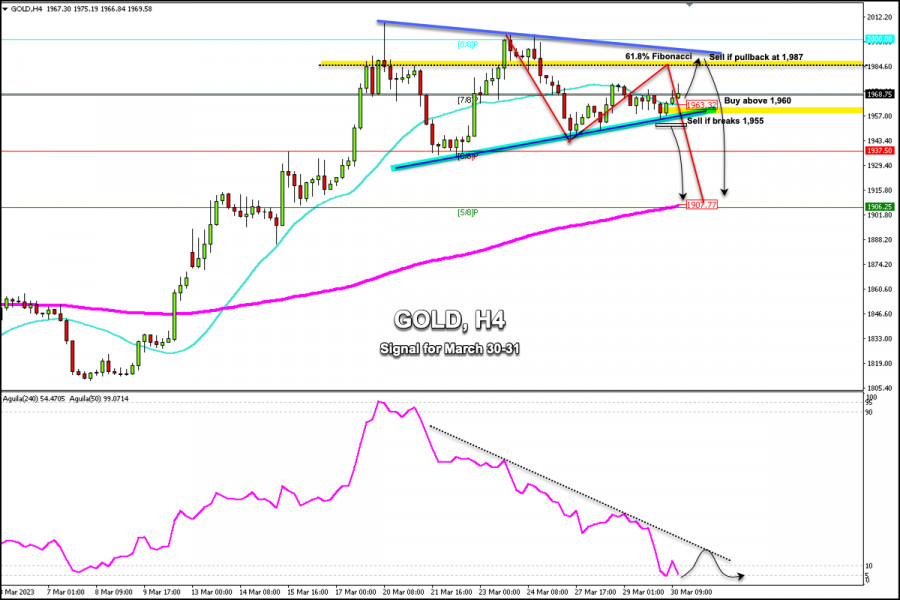
Early in the American session, Gold (XAU/USD) is trading around 1,968 above 7/8 Murray and above the 21 SMA located at 1,963.32.

According to the 4-hour chart, we can see that gold is making a technical rebound after falling from the high of 2,003.21 to the low of 1,943.86.

This movement could mean a correction towards the 61.8% Fibonacci, located around 1,984. A pullback towards this area could be a sign for gold to resume its bearish cycle and it could reach the 200 EMA located at 1,907 in the next few days.

XAU/USD is currently trading above the 21 SMA located at 1,963 which favors a bullish movement. If it consolidates above this level, it could continue to rise until it reaches 1,975 and 1,987.

A pullback to the resistance zone of the downtrend channel formed between the high of 2009 and 2003 could be a point to sell around 1,987, with targets at 1,950 and 1,907 (200 EMA).

For gold to resume its bullish cycle, we should expect a sharp break above 1,990 and consolidation above 8/8 Murray (2000). Then, the metal could reach +1/8 Murray located at 2,031.25.

Conversely, for gold to turn more bearish, it will need to break the bottom of the uptrend channel formed between the low of 1,934 and 1,943. Then, it could reach 1,937 (6/8 Murray) and 1,907 (200 EMA).

The Eagle indicator has reached the extremely oversold zone around 5 points which is likely to be followed by any technical bounce. As long as it does not break its pressure line, it could be a signal to sell.

Dimitrios Zappas,
Analytical expert of InstaForex
© 2007-2025
选择时间框架
5
分钟
15
分钟
30
分钟
1
小时
4
小时
1
1
通过InstaForex赚取加密货币汇率变动的收益。
下载MetaTrader 4并开启您的第一笔交易。
  • Grand Choice
    Contest by
    InstaForex
    InstaForex always strives to help you
    fulfill your biggest dreams.
    JOIN CONTEST

推荐文章

2025年6月11日星期三,澳元/日元交叉貨幣對的日內價格走勢技術分析。

從4小時圖來看,AUD/JPY交叉貨幣對似乎存在AUD/JPY價格走勢與隨機指標之間的背離,因此根據這一點,在不久的將來,AUD/JPY可能會走弱至93.84的水平。如果該水平被成功突破並收盤於其下方,那麼AUD/JPY可能會繼續走弱至93.34作為主要目標。

Arief Makmur 09:28 2025-06-11 UTC+2

2025年6月11日,週三,美元/印尼盾外匯貨幣對日常價格走勢的技術分析。

目前有一些關於 USD/IDR 的有趣事實,首先,USD/IDR 的價格走勢低於 WMA(21),其次, Bearish 123 型態的出現並伴隨著幾個 Bearish Ross Hook (RH),第三,USD/IDR 的價格走勢與隨機震盪指標之間出現了匯合形態。因此,基於這三個事實,在不久的將來,USD/IDR 有可能繼續走弱,並測試突破並低於最近的 Bearish Ross Hook 水平 16149.00。

Arief Makmur 09:28 2025-06-11 UTC+2

6月11日至13日的比特幣(BTC/USD)交易信號:在$110,700以下賣出(21日簡單移動平均線 - 200日指數移動平均線)

比特幣目前交易於110,726,經歷了技術性調整,此水平是5月底見到的。 比特幣形成了雙頂形態,因此我們認為,如果它在110,700以下鞏固,我們可以預期技術性調整至107,586,甚至可能達到104,146(200日均線)。

Dimitrios Zappas 05:16 2025-06-11 UTC+2

XAU/USD黃金交易信號:2025年6月11日至14日,低於$3,340賣出 (21 SMA - 7/8 Murray)

在歐洲交易時段早期,黃金在3,334左右交易,顯示出疲態,因為它在昨天的美洲交易時段中曾升過3,300。這一價格水平對黃金而言是關鍵的,因為我們可能預期在該區域以下進行技術性回調。

Dimitrios Zappas 05:09 2025-06-11 UTC+2

2025年6月11日歐元/美元匯率預測

昨天,美元試圖將歐元壓低至由每日平衡指標和MACD指標線標示的重要技術支撐位之下,但歐元承受住了壓力,並在1.1420阻力位以上收盤。 在今天的開盤價位高於該水平,且指標線標記了一個關鍵時刻:這是單一貨幣可能發展上升走勢的最後一天,因為價格現在處於由目標水平和MACD線形成的三角形的頂點。

Laurie Bailey 04:41 2025-06-11 UTC+2

2025年6月11日英鎊/美元匯率預測

英國昨天發佈的五月就業數據顯示,失業率從4.5%上升至4.6%,失業救濟申請人數增加了33,100人。因此,英鎊下跌了50點。

Laurie Bailey 04:41 2025-06-11 UTC+2

2025年6月11日白銀預測

在過去的七個交易日中,銀價出現了顯著的上漲,但其增長潛力仍遠未耗盡。38.500 的目標——價格通道的上邊界——依然有效。

Laurie Bailey 04:41 2025-06-11 UTC+2

2025年6月10日歐元/美元匯率預測

週一,歐元/美元貨幣對在1.1380和1.1454之間橫盤整理,形成了一個區間。因此,從1.1374–1.1380的支撐區反彈,將有利於歐元,並進一步增長至1.1454的76.4%回調位。

Samir Klishi 10:33 2025-06-10 UTC+2

GBP/USD。6月10日。英國失業率上升

在小時圖上,週一的 GBP/USD 對於在 1.3520 的 161.8% 矯正水平做出了兩次反彈,但未能開始上升。今天,週二,該對在此水平下方進行了鞏固,預期將繼續下跌到 1.3425 水平,以及 1.3344–1.3357 的支撐區。

Samir Klishi 10:21 2025-06-10 UTC+2

2025年6月10日(星期二)歐元/美元主要貨幣對的日內價格走勢技術分析。

在出現「上升擴大型楔形」之後,隨之出現了「看跌123」型態,這給出了一個跡象,顯示在不久的將來,EUR/USD 可能會走弱。尤其是在 EUR/USD 價格走勢與 CCI 指標(30)之間出現背離,這增強了不久的將來 Fiber 走弱的可能性,並且 1.1372 水平將會受到考驗。

Arief Makmur 05:59 2025-06-10 UTC+2
现在无法通话?
提出您的问题,用 在线帮助.
Widget callback
 

Dear visitor,

Your IP address shows that you are currently located in the USA. If you are a resident of the United States, you are prohibited from using the services of InstaFintech Group including online trading, online transfers, deposit/withdrawal of funds, etc.

If you think you are seeing this message by mistake and your location is not the US, kindly proceed to the website. Otherwise, you must leave the website in order to comply with government restrictions.

Why does your IP address show your location as the USA?

  • - you are using a VPN provided by a hosting company based in the United States;
  • - your IP does not have proper WHOIS records;
  • - an error occurred in the WHOIS geolocation database.

Please confirm whether you are a US resident or not by clicking the relevant button below. If you choose the wrong option, being a US resident, you will not be able to open an account with InstaForex anyway.

We are sorry for any inconvenience caused by this message.