


signal strength 2 of 5
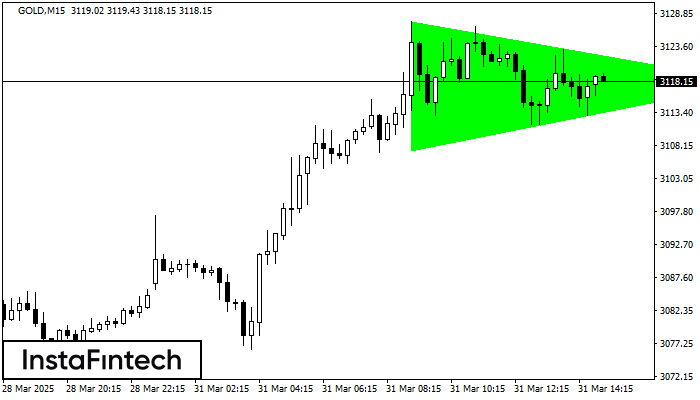
According to the chart of M15, GOLD formed the Bullish Symmetrical Triangle pattern. Description: This is the pattern of a trend continuation. 3127.49 and 3107.40 are the coordinates of the upper and lower borders respectively. The pattern width is measured on the chart at 2009 pips. Outlook: If the upper border 3127.49 is broken, the price is likely to continue its move by 3118.29.
The M5 and M15 time frames may have more false entry points.
See Also
- All
- Double Top
- Flag
- Head and Shoulders
- Pennant
- Rectangle
- Triangle
- Triple top
- All
- #AAPL
- #AMZN
- #Bitcoin
- #EBAY
- #FB
- #GOOG
- #INTC
- #KO
- #MA
- #MCD
- #MSFT
- #NTDOY
- #PEP
- #TSLA
- #TWTR
- AUDCAD
- AUDCHF
- AUDJPY
- AUDUSD
- EURCAD
- EURCHF
- EURGBP
- EURJPY
- EURNZD
- EURRUB
- EURUSD
- GBPAUD
- GBPCHF
- GBPJPY
- GBPUSD
- GOLD
- NZDCAD
- NZDCHF
- NZDJPY
- NZDUSD
- SILVER
- USDCAD
- USDCHF
- USDJPY
- USDRUB
- All
- M5
- M15
- M30
- H1
- D1
- All
- Buy
- Sale
- All
- 1
- 2
- 3
- 4
- 5
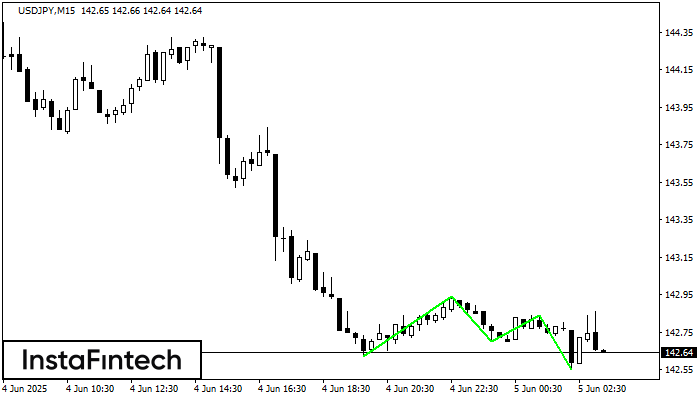
По USDJPY на M15 сформировалась фигура «Тройное дно». Характеристика: Нижняя граница фигуры имеет координаты 142.55, при этом верхняя граница 142.94/142.84. Проекция ширины 24 пунктов. Формирование фигуры «Тройное дно» наиболее вероятным
Таймфреймы М5 и М15 могут иметь больше ложных точек входа.
Открыть график инструмента в новом окне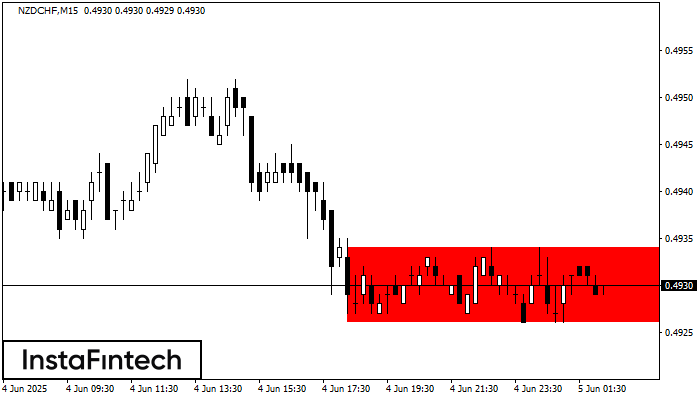
По торговому инструменту NZDCHF на M15 сформировалась фигура продолжения тренда - «Прямоугольник». Фигура имеет границы: Нижняя 0.4926; Верхняя 0.4934. В случае пробоя нижней границы вероятно дальнейшее движение в сторону тренда
Таймфреймы М5 и М15 могут иметь больше ложных точек входа.
Открыть график инструмента в новом окне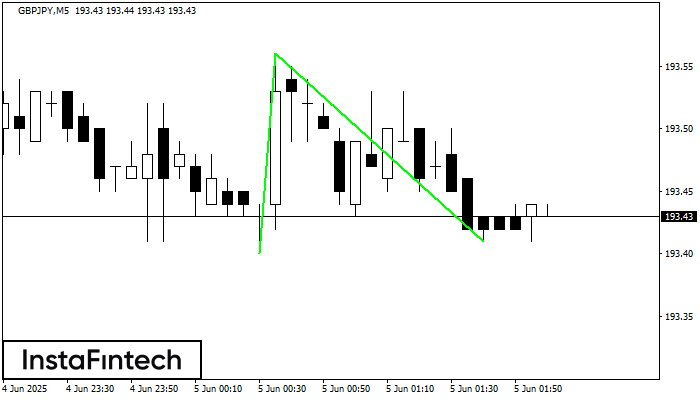
Сформирована фигура «Двойное дно» на графике GBPJPY M5. Данное формирование сигнализирует об изменении тенденции с нисходящего на восходящее движение. Сигнал: Торговую позицию на покупку следует открывать после пробоя верхней границы
Таймфреймы М5 и М15 могут иметь больше ложных точек входа.
Открыть график инструмента в новом окне


